Introduction
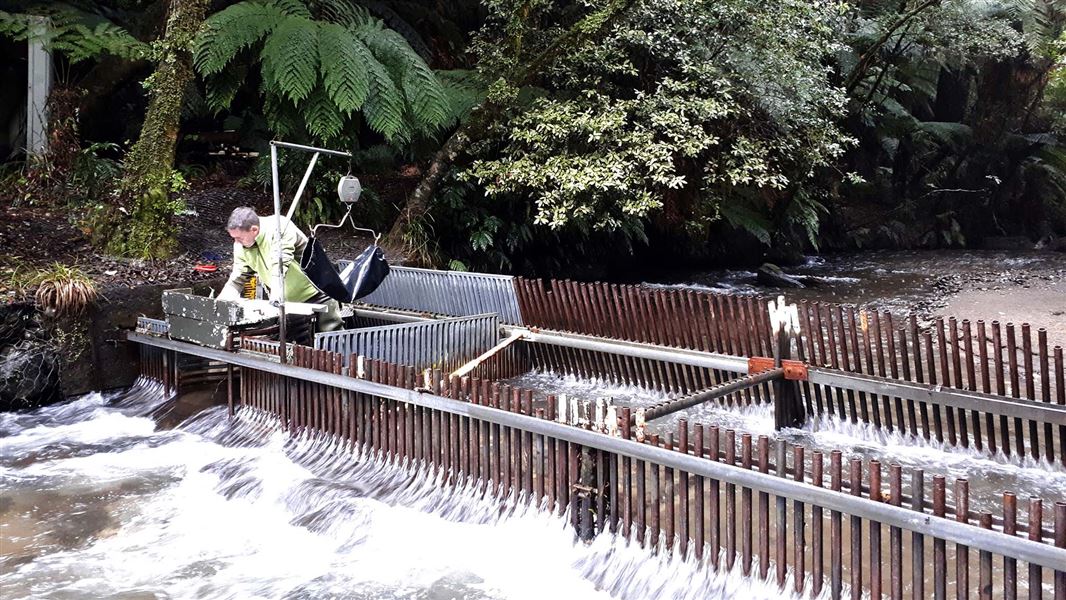
July's edition of the Waipa Stream fish trap report.Located on the Waipa Stream, the Waipa spawning trap is positioned within a significant spawning tributary of the Tongariro River, 24 km upstream from Lake Taupo.
Fishery Rangers record the numbers of trout, their sex, length, weight and iteroparity (how many times individual fish have spawned). From this data we also determine a Condition Factor, which reflects how much food has been available to the trout.
This trap has been operational since 1998 and has provided a valuable long-term data set. We view this information in combination with a variety of other studies such as angler surveys, drift dives and lake productivity work, to ensure a broad understanding of fishery's health.
Trap data for July
We're now well into the winter fishing season and although temperatures have finally dropped after a mild start to winter, the number of trout entering the fish trap has continued to increase. July recorded a total of 177 trout trapped with browns still accounting for 54% of the total monthly run. The fish trap was operating for a total of 23 days during July with two floods 'overtopping' the trap during early and mid-July.
Overall the trap captured an average of 8 trout per day:
- 3.7 rainbows per day, and
- 4.2 browns per day.
The max number of trout trapped in a single day was 25:
- 10 rainbows, and
- 15 browns.
August onwards should see rainbow trout dominate the data as the brown trout spawning run comes to an end. Data from recent years have shown that 70% of the rainbow trout spawning occurs between September and December. As a result, the number of rainbows in the region's rivers should increase significantly over the next 3 months.
Comparison with last year
Compared to the same period last year, we continue to see an improvement in the size and Condition Factor (CF) of trout across both browns and rainbows. Overall, rainbows are 24mm longer and 300 g heavier than those trapped during the same time last year. Similarly, the browns are on average 8mm longer and 300g heavier this year. This aligns with reports from the angling community. The graphs and tables clearly indicate improvements across the board for Brown Females (BF), Brown Males (BM), Rainbow Females (RF) and Rainbow Males (RM).
'Drift diving' is another scientific technique we use to gather data on the number of trout spawning in other locations around the Taupō region. These dives commenced at the end of July and will continue through until the end of the spawning season. Early results mirror what we are seeing in the fish trap, with rainbow trout counts across many of the eastern tributaries yet to reach maximum levels.
Additional Waipa trap monthly report data – July 2019 (XLSX, 67K)
| July 2019 | July 2018 | |||||||||||
|---|---|---|---|---|---|---|---|---|---|---|---|---|
| Brown trout female | Brown trout male | Rainbow trout female | Rainbow trout male | Total | Total rainfall (mm) | Brown trout female | Brown trout male | Rainbow trout female | Rainbow trout male | Total | Total rainfall (mm) | |
| Count | 45 | 51 | 40 | 41 | 177 | 349.5 | 51 | 26 | 33 | 36 | 146 | 236 |
| Average length (mm) | 596 | 606 | 515 | 519 | 589 | 603 | 493 | 495 | ||||
| Max length (mm) | 670 | 685 | 600 | 610 | 685 | 675 | 570 | 590 | ||||
| Average weight (kg) | 2.8 | 2.7 | 1.7 | 1.6 | 2.5 | 2.5 | 1.5 | 1.4 | ||||
| Max weight (kg) | 3.65 | 3.6 | 2.6 | 2.6 | 3.2 | 3.45 | 2 | 2.5 | ||||
| Condition factor | 47.5 | 44.5 | 44.3 | 42.3 | 44.5 | 40.8 | 43 | 40.3 | ||||