
Tahr sighting and control maps 2022
Introduction
View sighting and control maps from 2022, taken for operational plans between 2022 and 2023. They include control operations and where tahr had been seen on public conservation land.Maps from Tahr Control Operational Plan 2022/23
Maps are posted to this page following tahr control operations. These maps show where operations have taken place and how many tahr have been controlled.
As DOC has not targeted identifiable male tahr outside of the national parks (Management Unit 4), observations of identifiable males across parts of 425,000 ha of public conservation land have been recorded and shared on this page to help hunters plan their next hunt.
DOC aerial control within the feral range, which includes all Management Units, is complete under the 2022/23 Tahr Control Operational Plan, which runs through to 30 June 2023. Aerial control will continue outside the feral range and localised ground control operations are planned inside the feral range for 2023.
Note:
- DOC is only targeting all tahr inside Aoraki/Mount Cook and Westland Tai Poutini National Parks (Management Unit 4), and outside the feral range. This will help DOC to meet its legal obligations and protect these special places.
- Outside of the national parks (Management Unit 4), identifiable male tahr have been left for hunters across 425,000 ha of public conservation land.
| Management unit | Date range of operations included | Identifiable male sightings | Identifiable males observed |
|---|---|---|---|
| MU1 South Rakaia/Upper Rangitata | November 2022 | There is no map for sightings in MU1 due to a recording error | 145 |
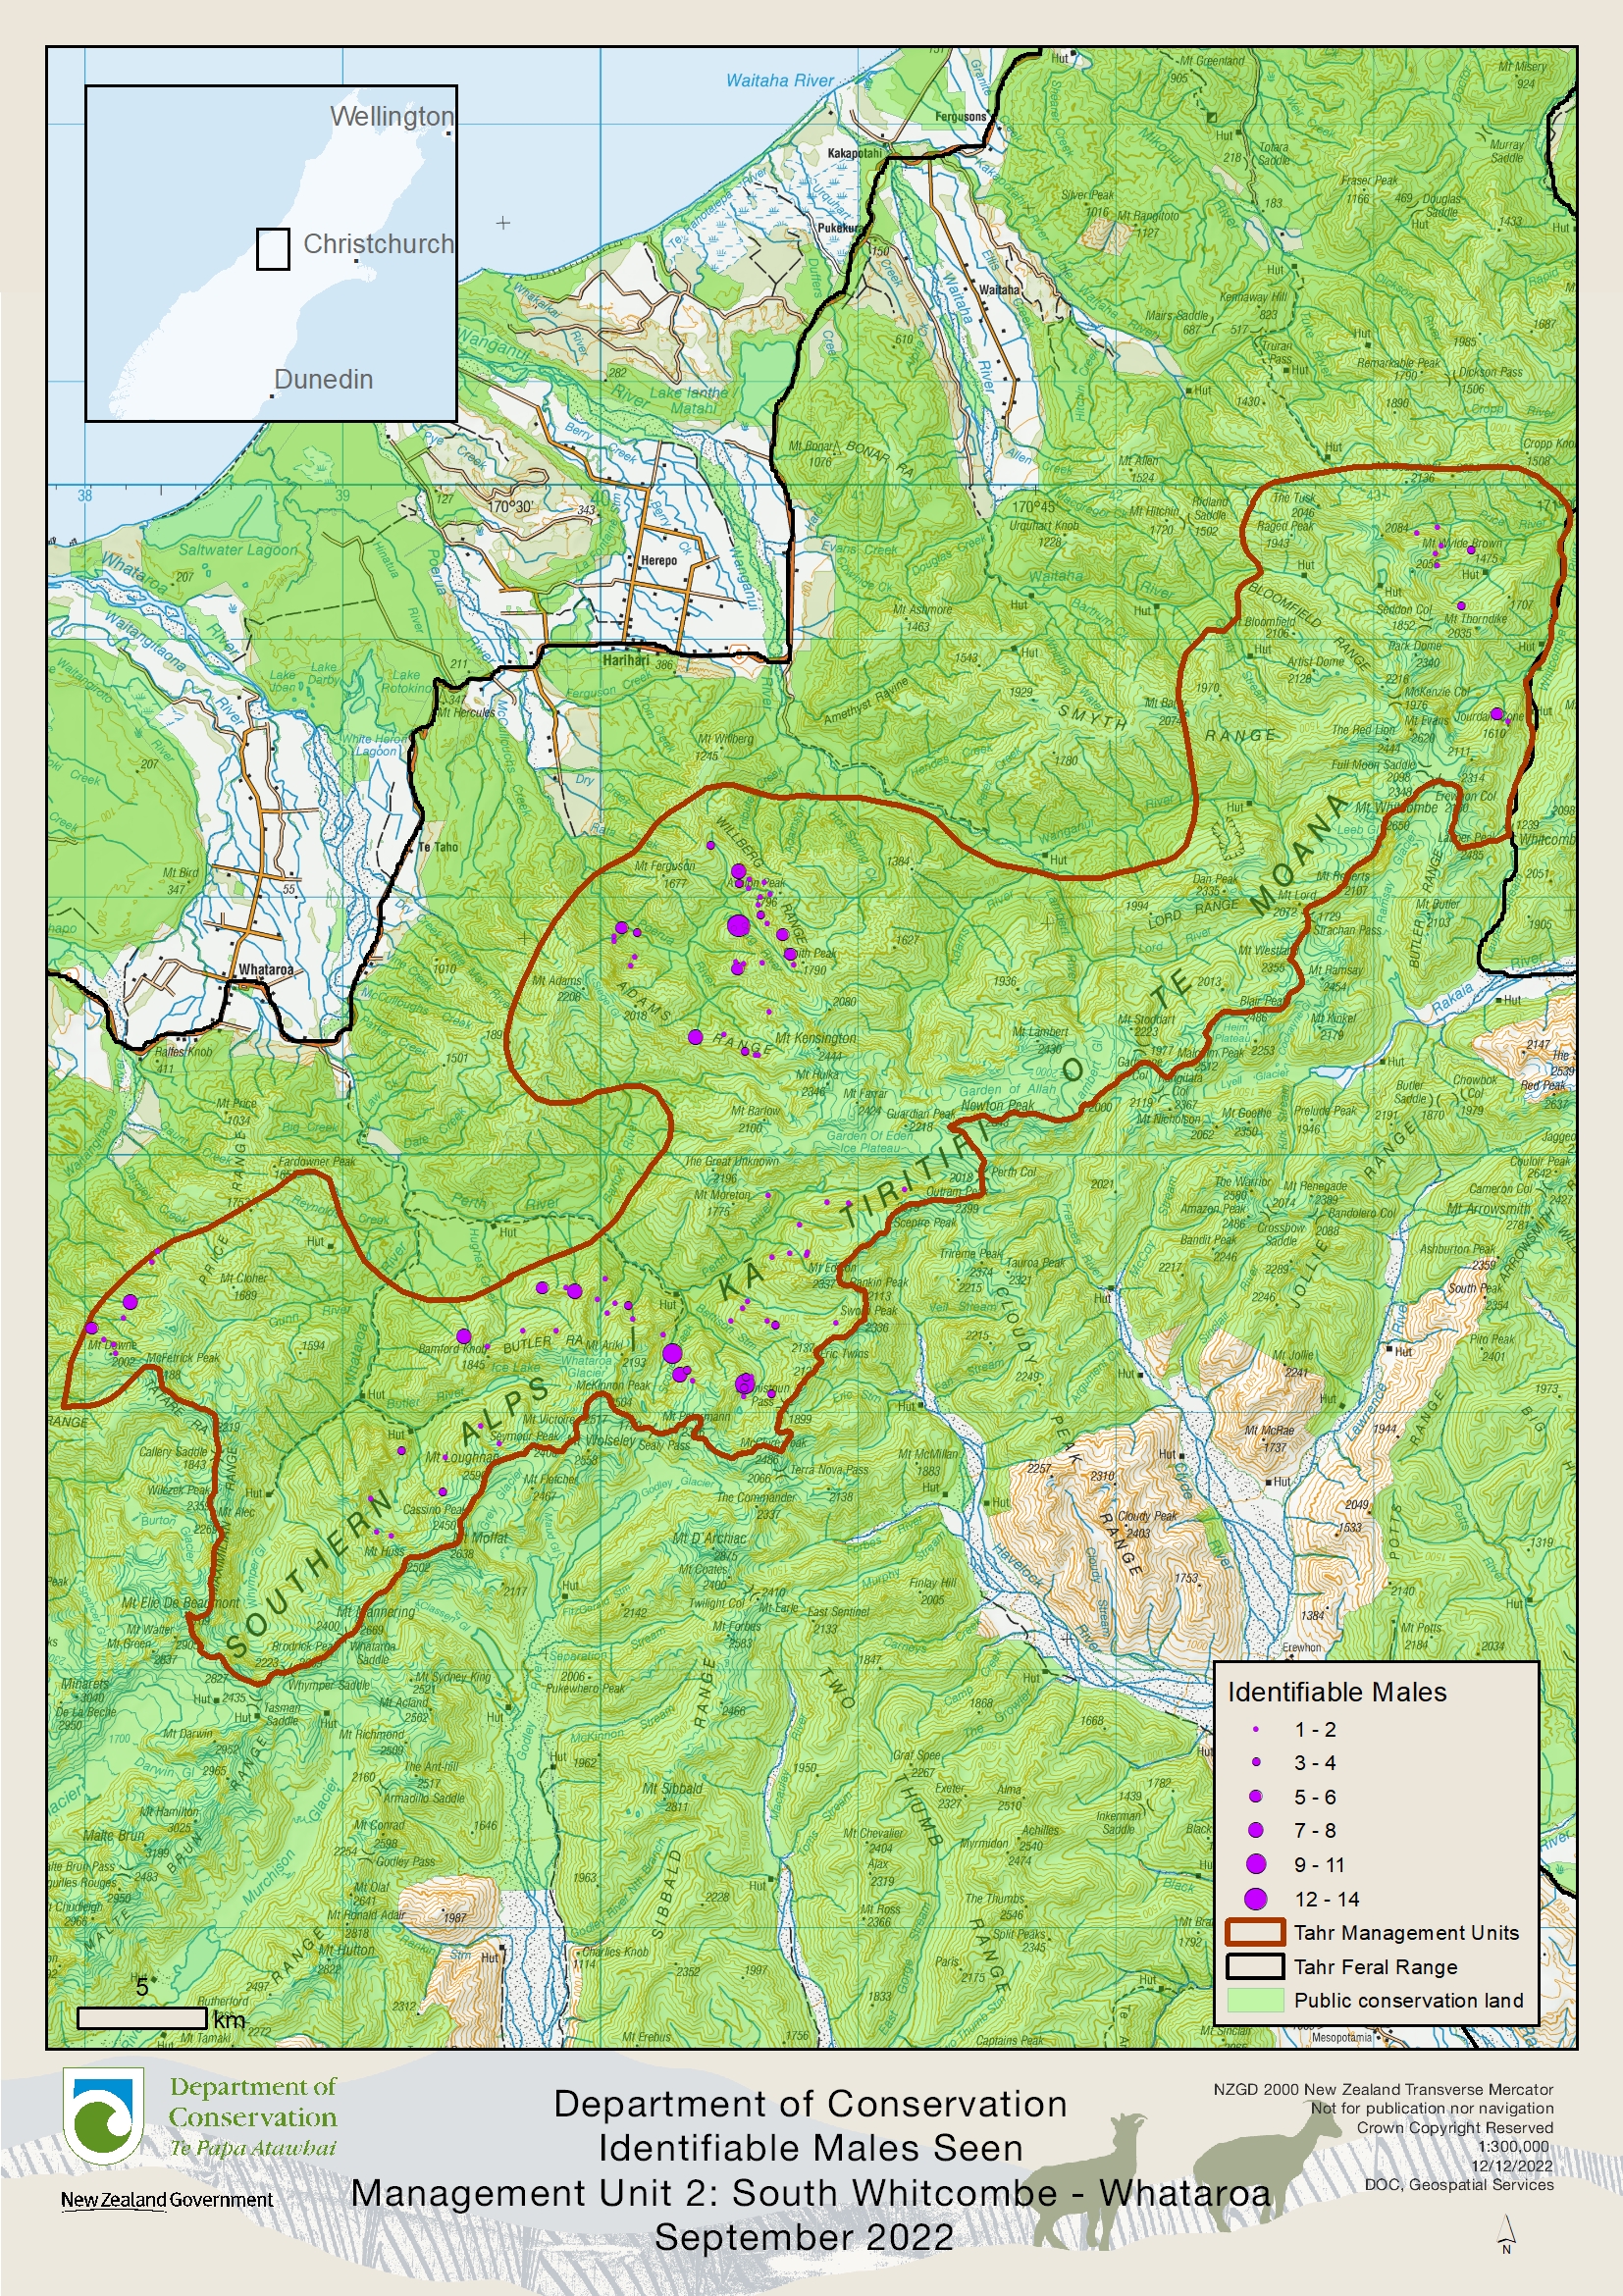
| MU2 South Whitcombe/ Wanganui/ Whataroa | October 2022 | Summary sightings map (JPG, 4,527K) | 253 |
| MU 3 Gammack – Two Thumb | July/August 2022 | Summary sightings map (PDF, 2,053K) | 170 |
| MU 5 Ben Ohau | July/August 2022 | Summary sightings map (PDF, 2,144K) | 66 |
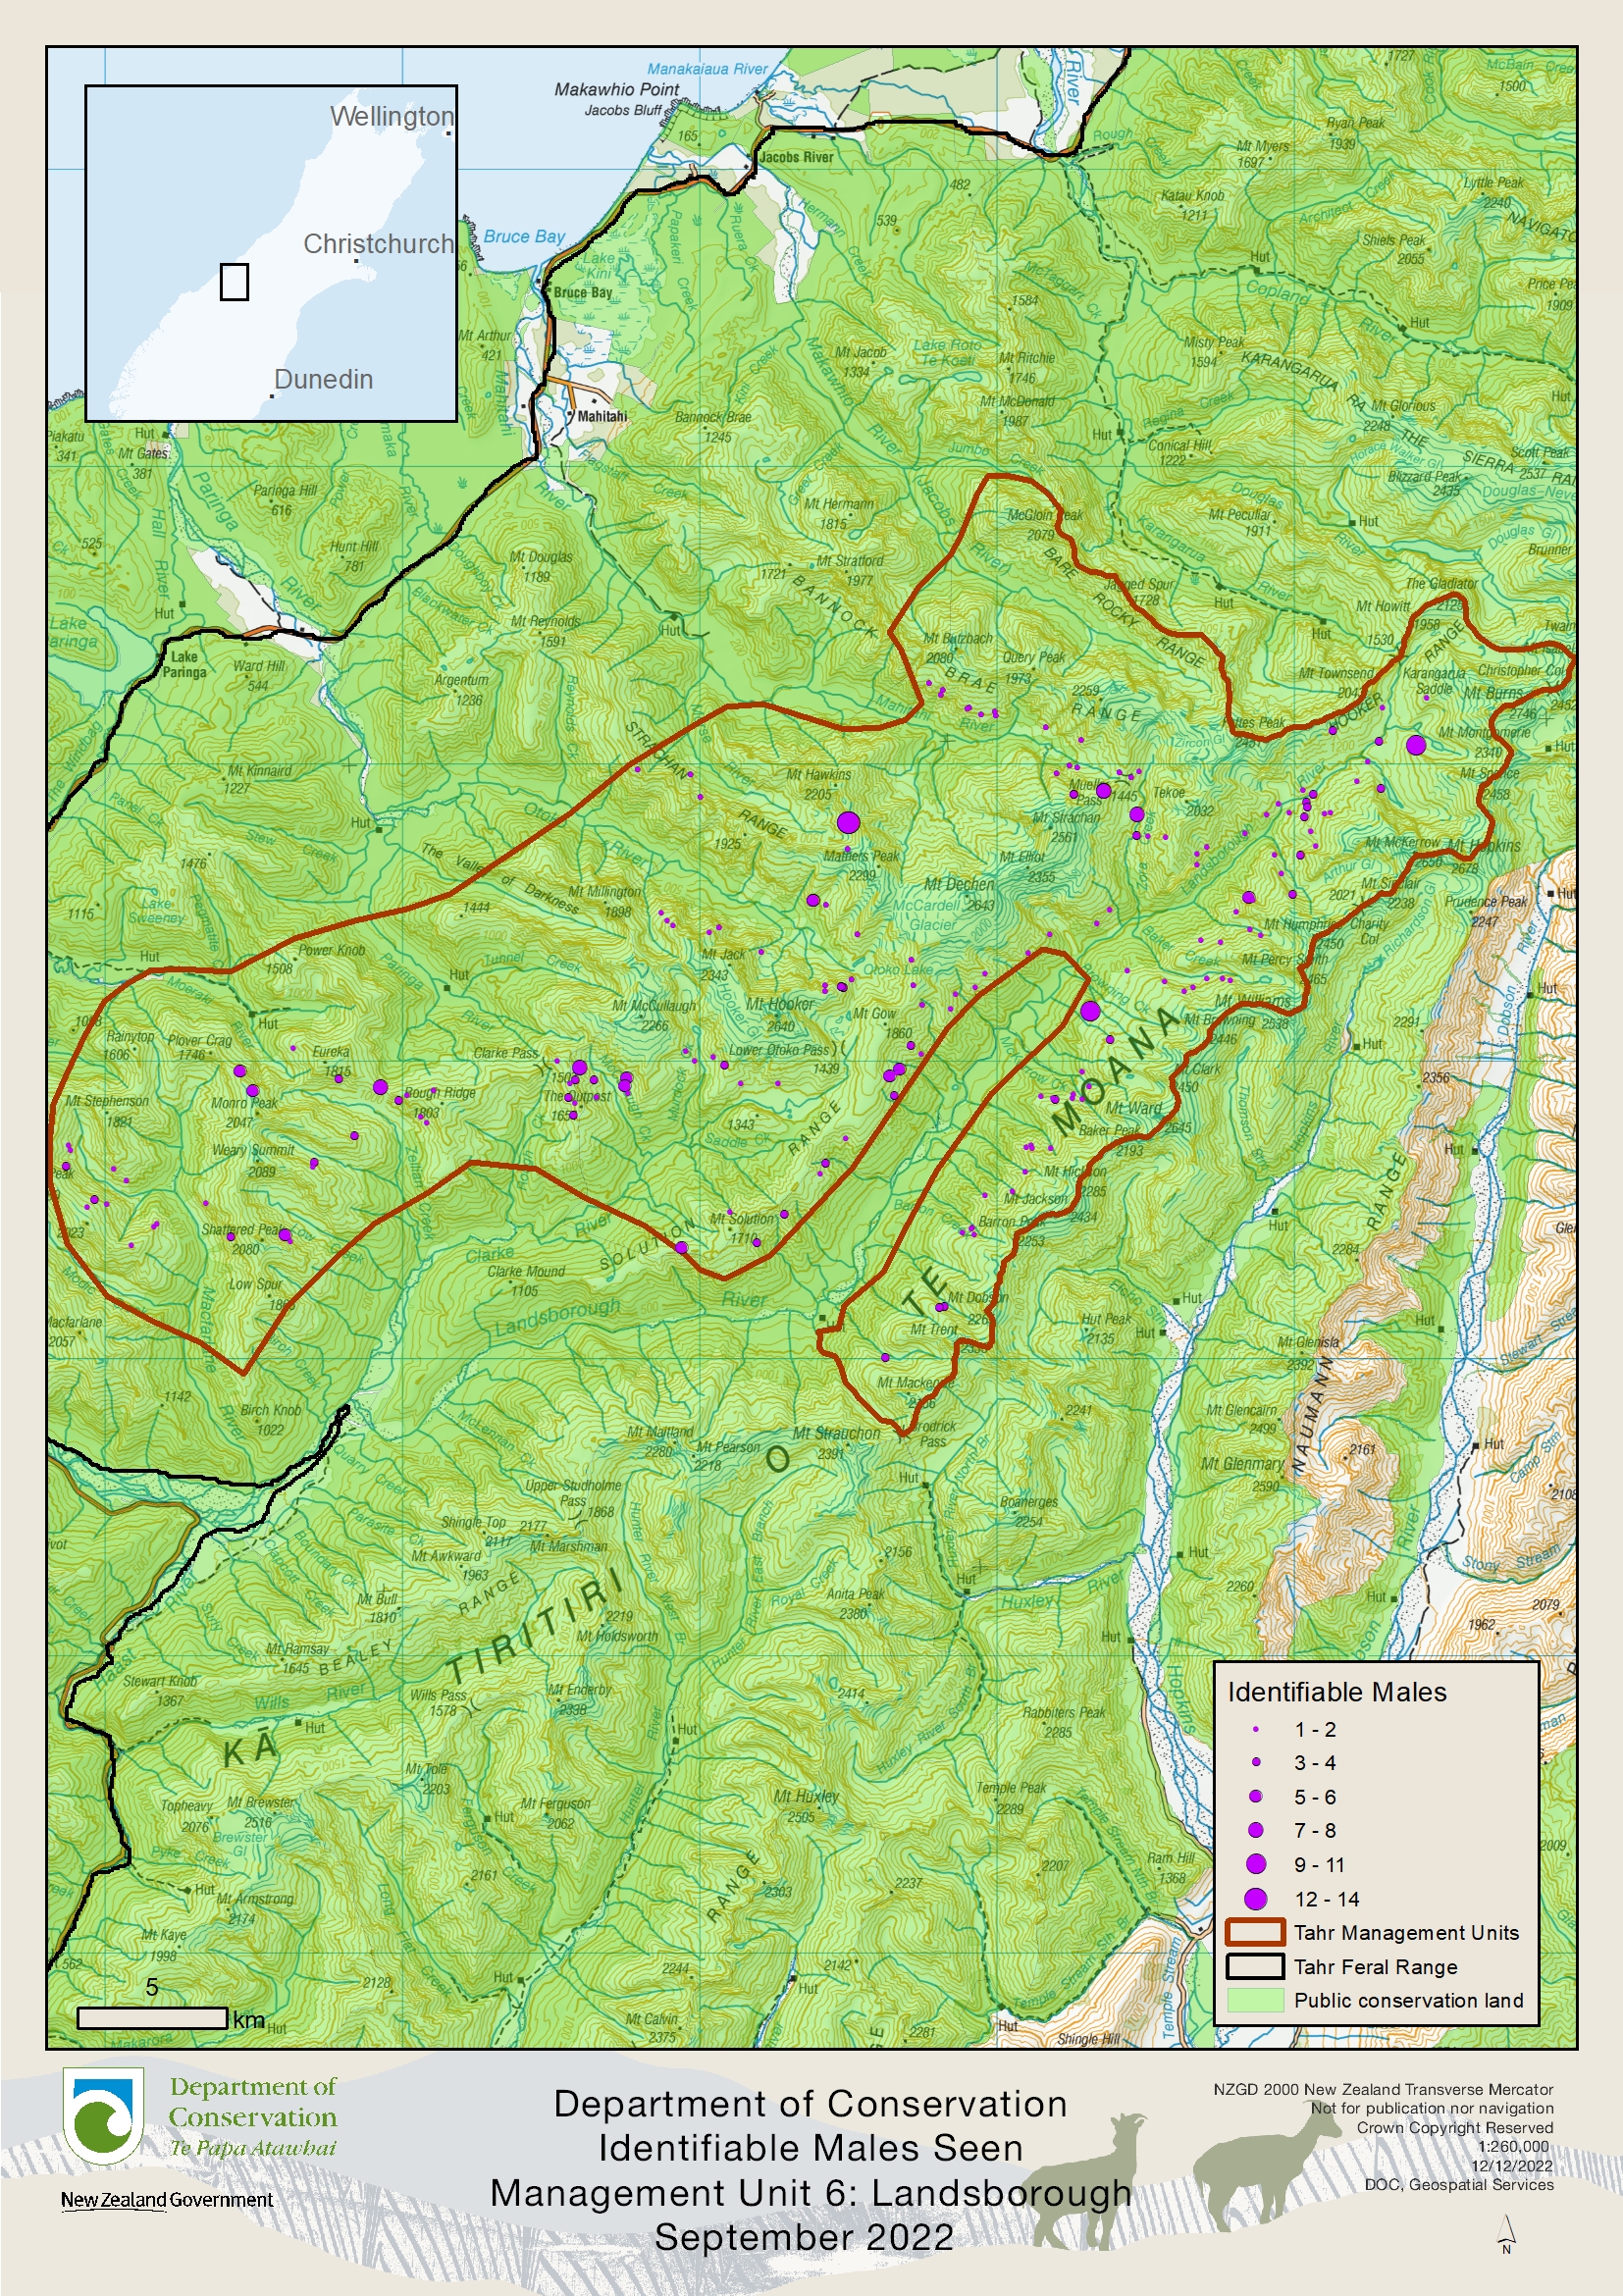
| MU 6 Landsborough | September 2022 | Summary sightings map (JPG, 4,068K) | 418 |
Note:
- Sightings of identifiable males observed in management units outside of Management Unit 4 (Aoraki/Mount Cook and Westland Tai Poutini National Parks) have been mapped.
- The circles represent the size of the tahr groups observed.
- It is possible some of the recorded sightings may be of the same animal observed on different occasions.
- If sightings are not recorded on a map at a particular location, tahr may still be present. DOC has not flown or hunted every valley within an individual management unit, or all management units in 2022/23.
| Management unit | Date of operation | Tahr control maps | Tahr controlled |
|---|---|---|---|
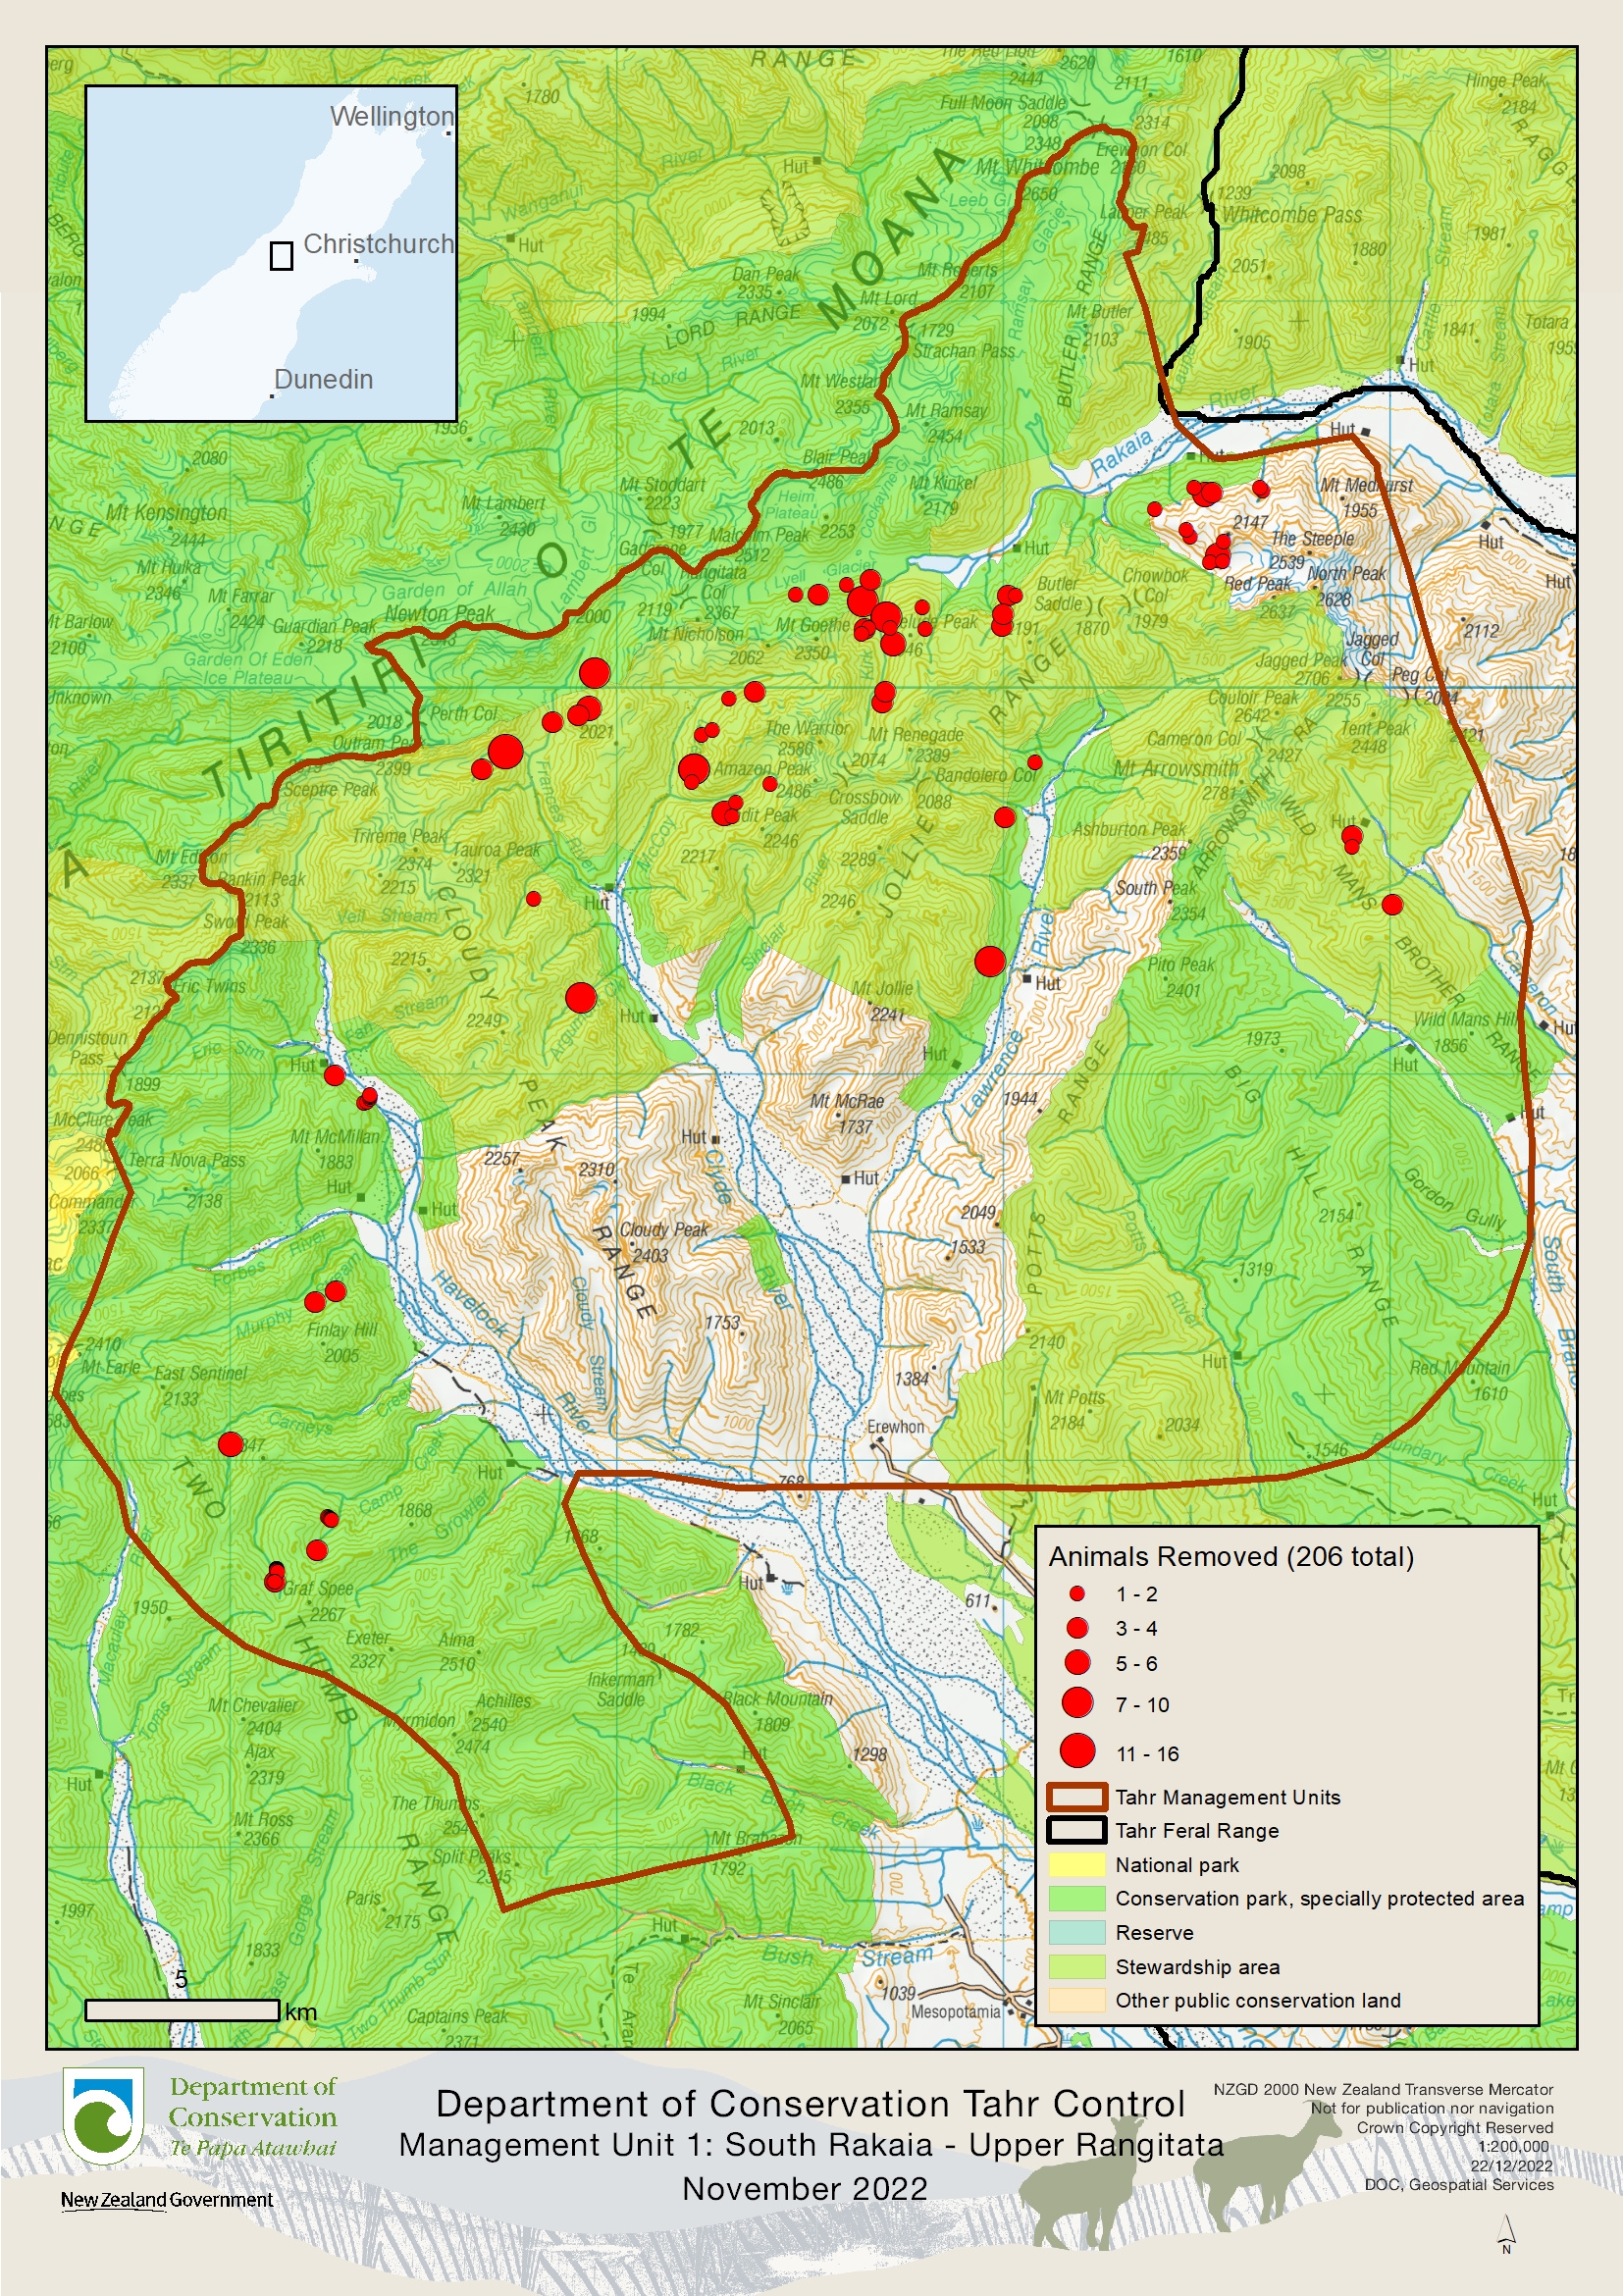
| MU1 South Rakaia/Upper Rangitata | November 2022 | Control map (JPG, 3,683K) | 206 female and juvenile |
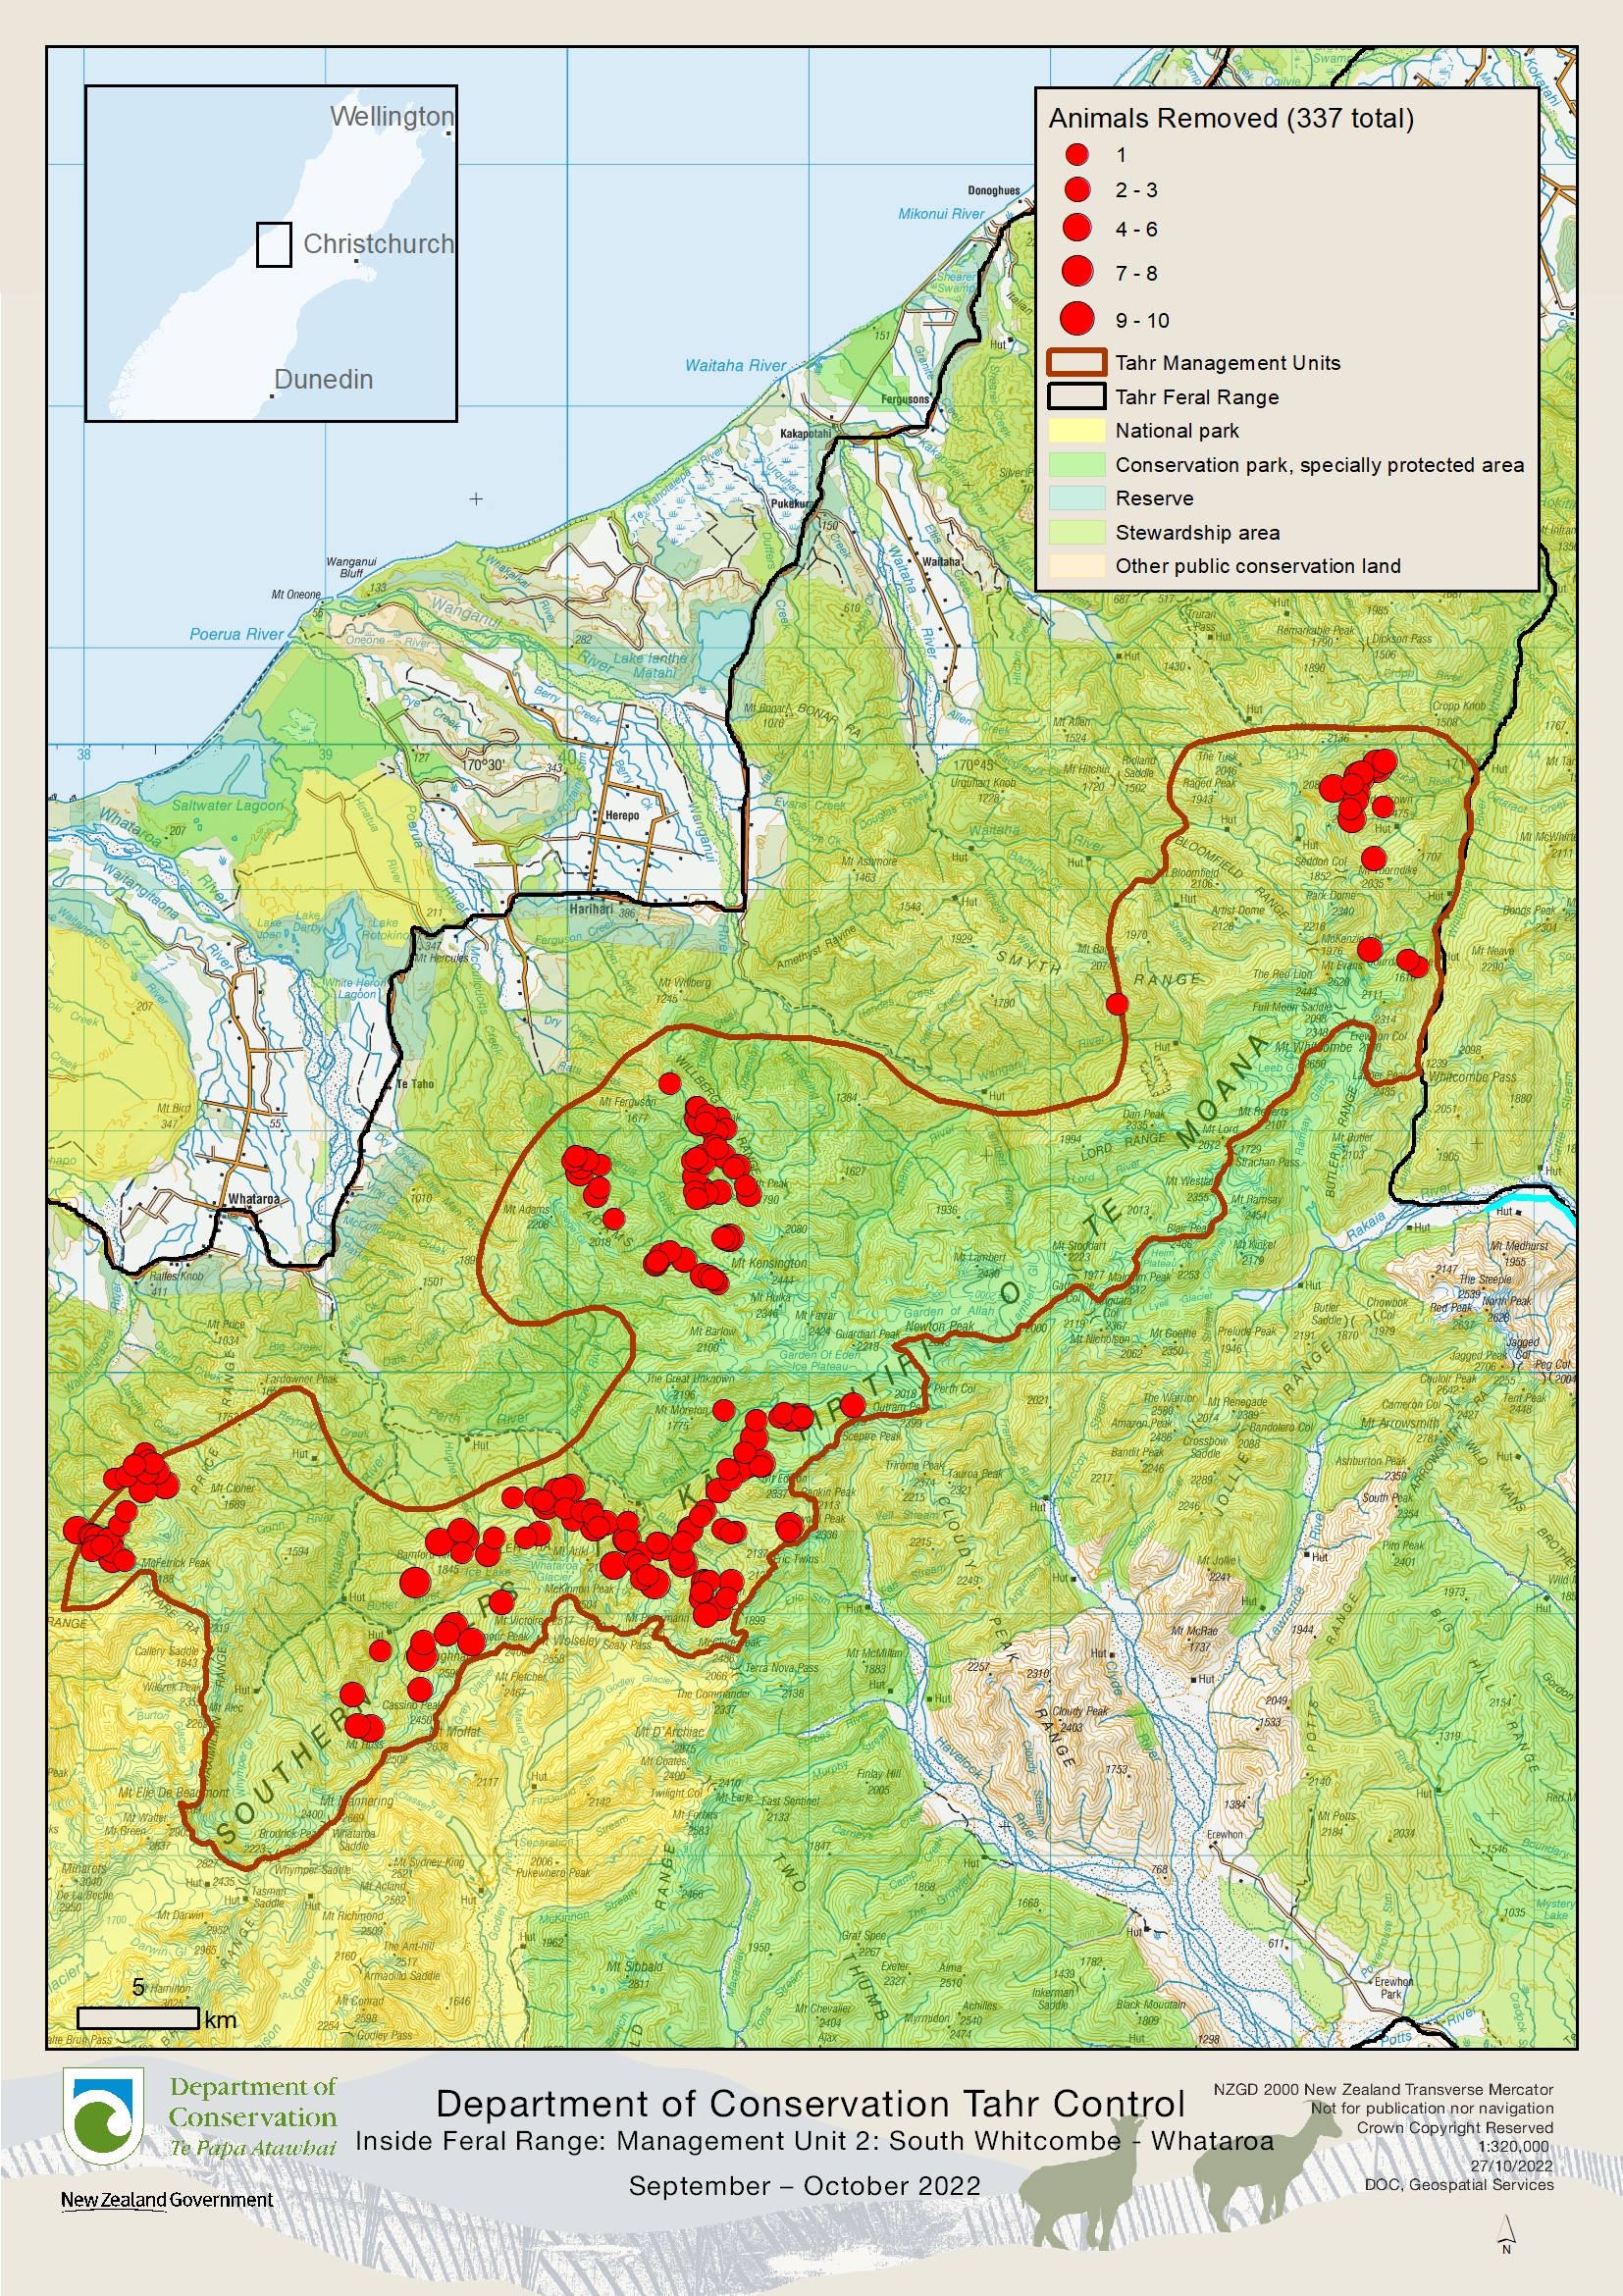
| MU2 South Whitcombe/ Wanganui/ Whataroa | October 2022 | Control map (JPG, 3,849K) | 337 female and juvenile |
| MU 3 Gammack – Two Thumb | July 2022 | Control map (PDF, 2,241K) | 334 female and juvenile |
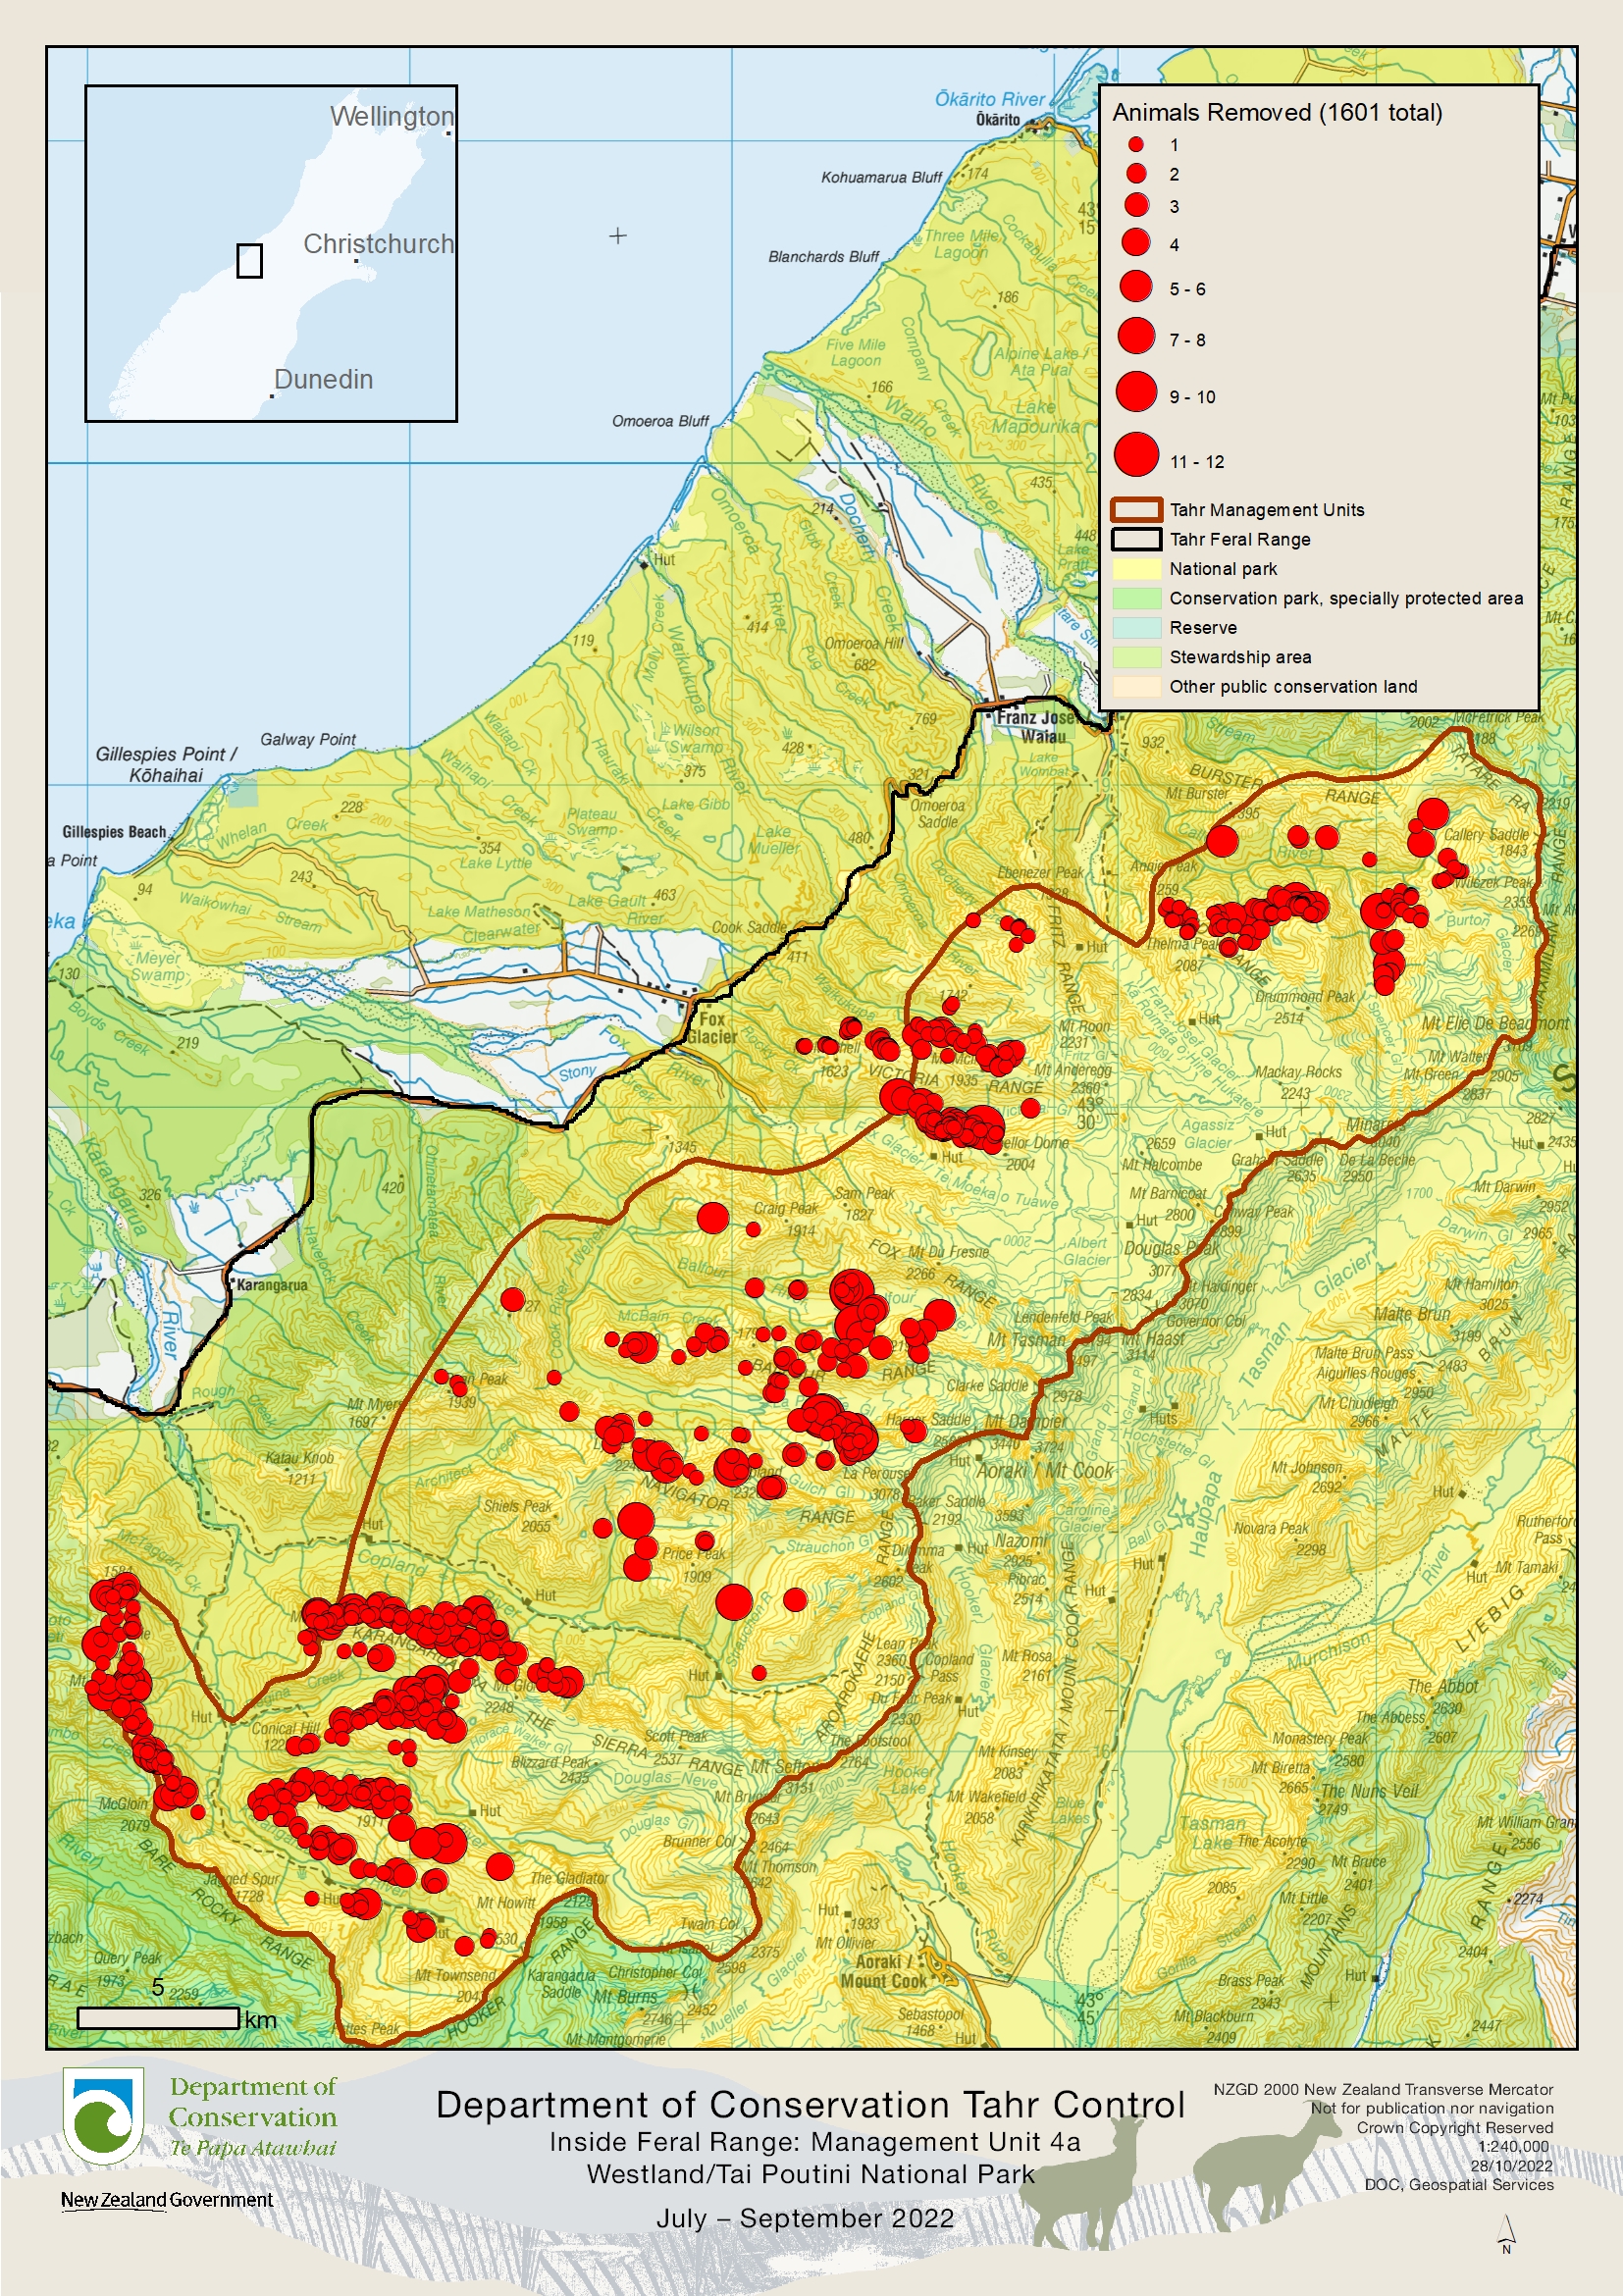
| MU 4A Westland Tai Poutini National Park | July-September 2022 | Control map (JPG, 3,410K) | 1,601 animals |
| MU 4B Aoraki/Mount Cook National Park | July 2022 | Control map (PDF, 2,028K) | 1,009 animals |
| MU 5 Ben Ohau | July 2022 | Control map (PDF, 2,080K) | 116 female and juvenile |
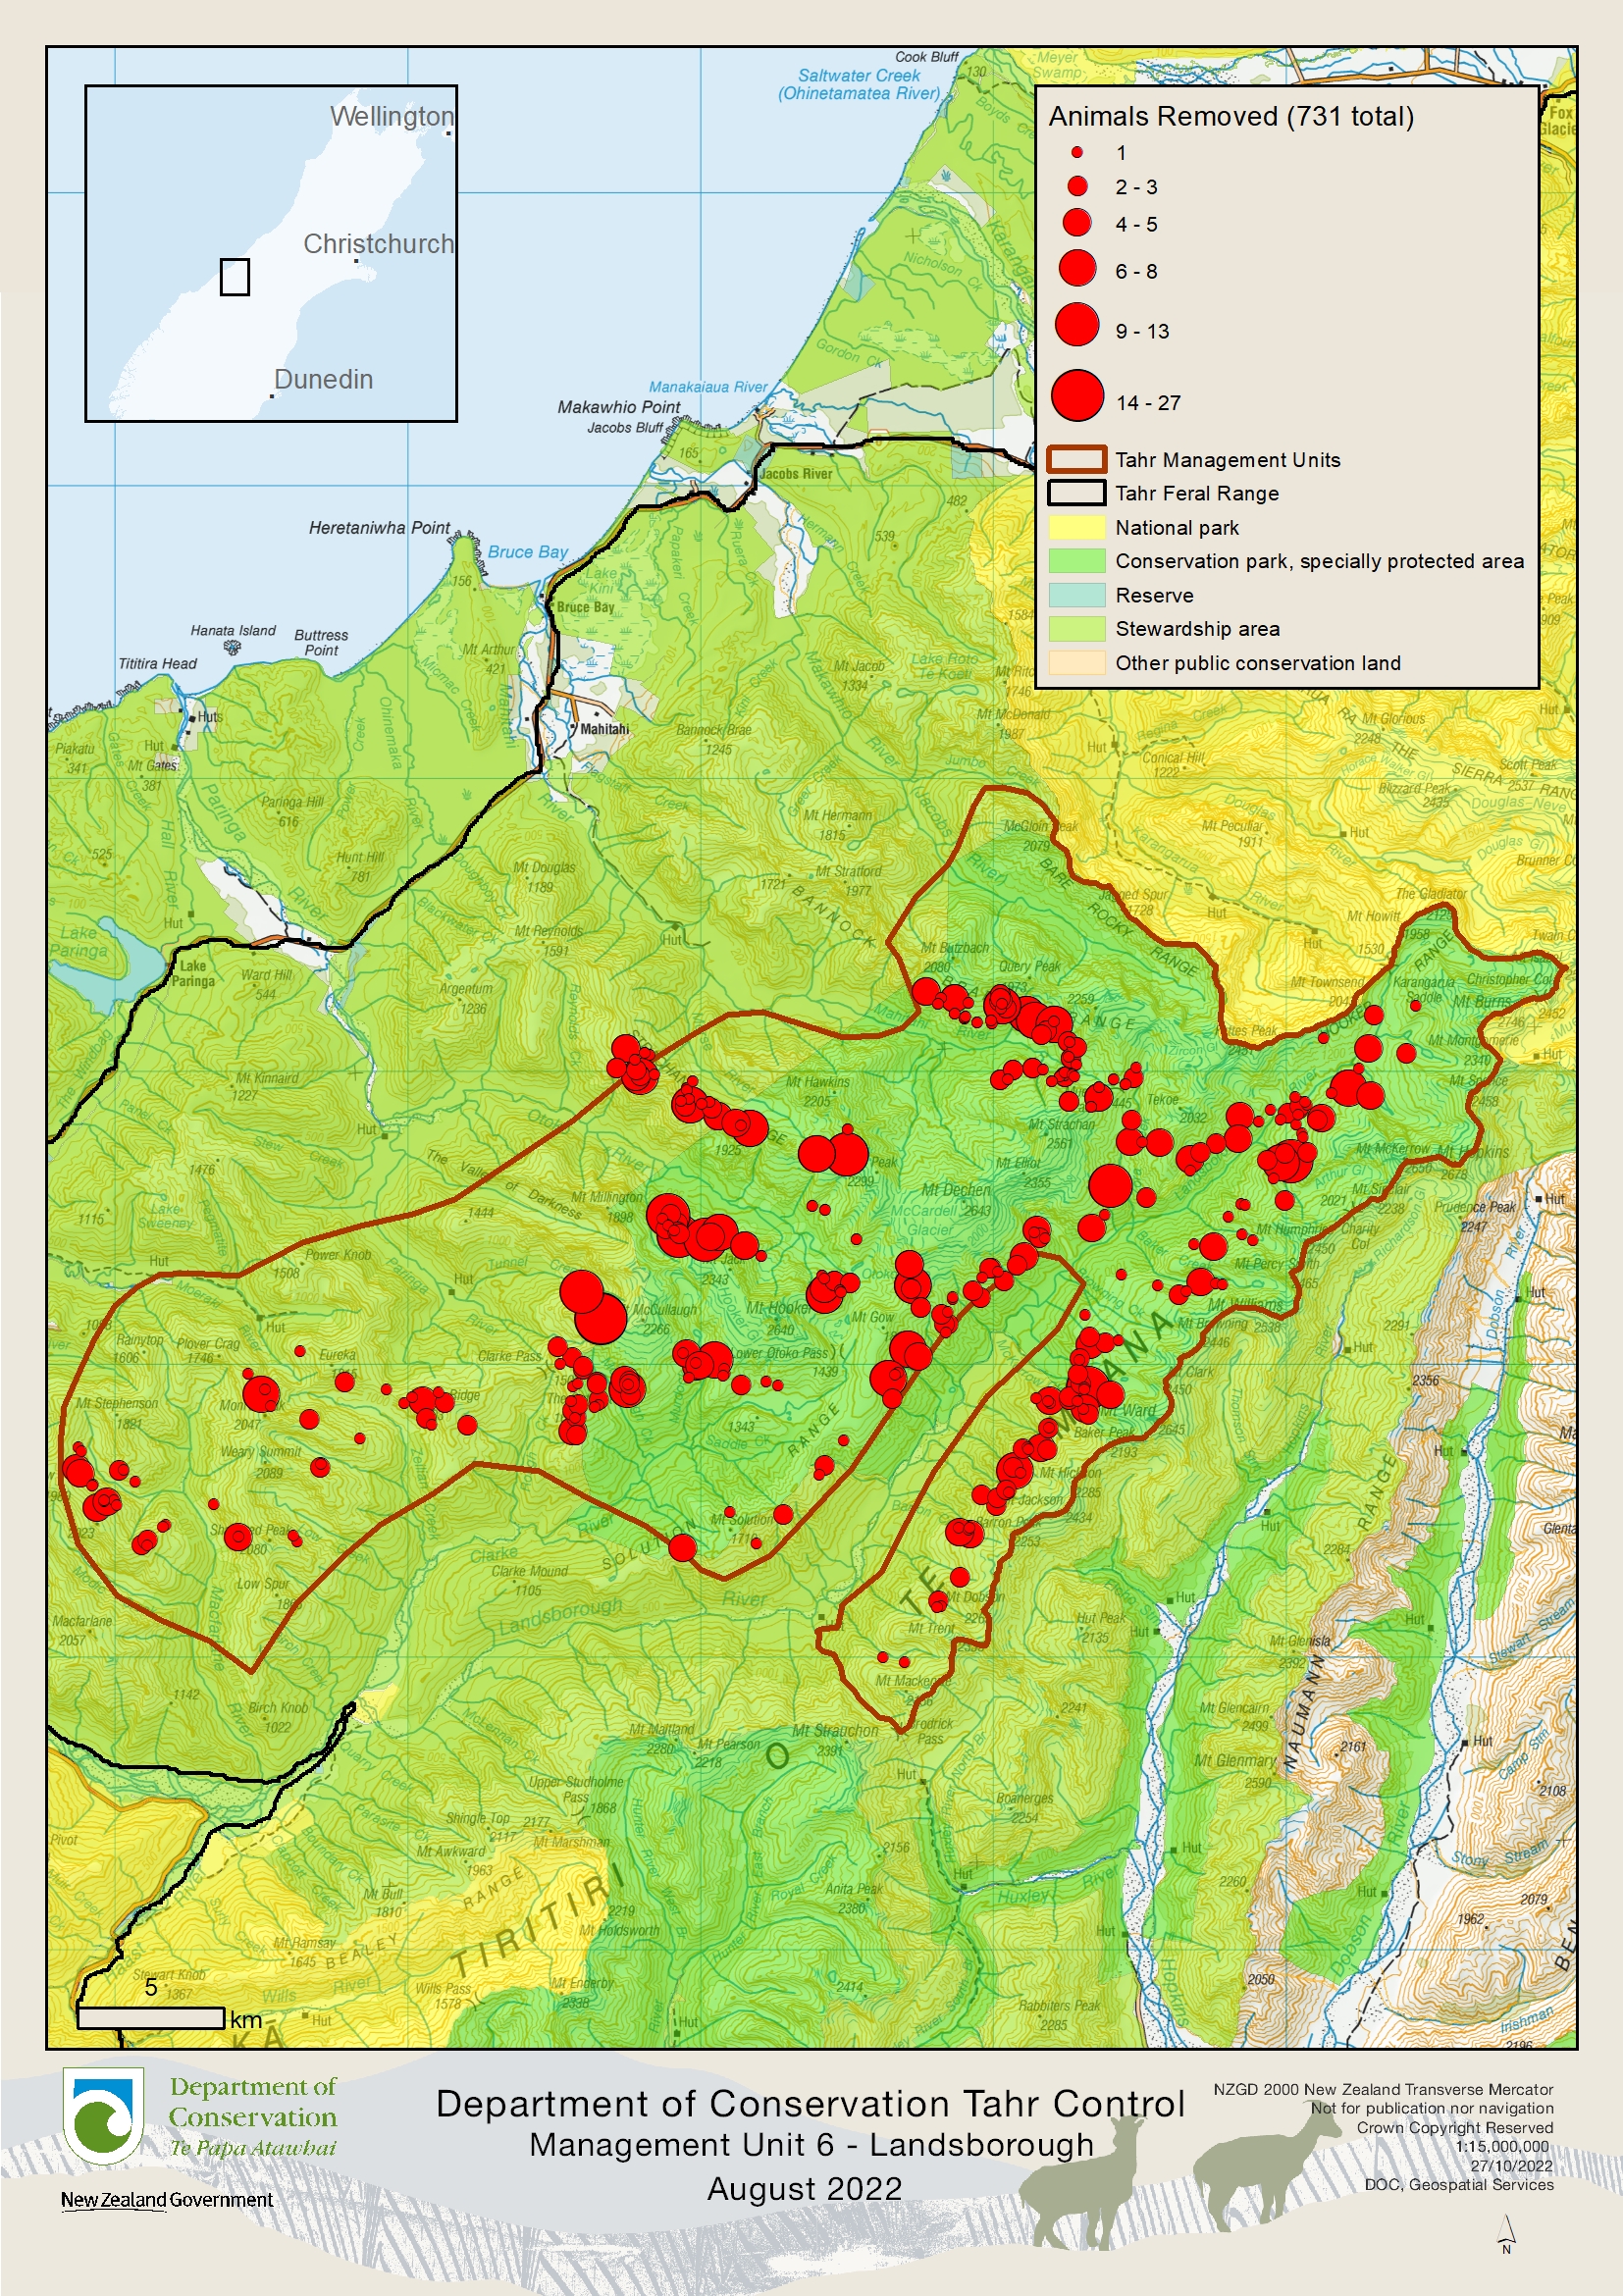
| MU 6 Landsborough | August 2022 | Control map (PDF, 3,401K) | 731 female and juvenile |
| Inside Feral Range, Outside Management Units | November 2022 | Map coming soon | 322 female and juvenile |
Notes:
- The circles represent the size of the tahr groups controlled/observed. In some cases individual animals belonging to clusters have been removed.
- Some areas may have been flown more than once.
Maps from tahr surveys in the South Rakaia/Rangitata and Gammack/Two Thumb Management Units (1 and 3)
DOC is publishing maps showing areas where large groups of tahr have been observed in popular hunting areas.
These observations were recorded over late Summer and Autumn 2021 as part of tahr population surveys in the South Rakaia/Rangitata and Gammack Two Thumb management units, east of the Southern Alps.
These maps are being published to encourage hunters to contribute to tahr control. More maps will be published when data is available.
Note:
- The surveys were undertaken between late February and early May 2021.
- The areas were mapped based on surveys undertaken on three separate occasions, and high tahr densities were observed each time.
- Other areas not surveyed within the two management units may also have high densities of tahr.
| Management unit | Area observed | Link to maps |
|---|---|---|
| MU 1 South Rakaia – Upper Rangitata | Upper Havelock / Macauley | |
| MU 3 Gammack – Two Thumb | Two Thumb / Sinclair Range |