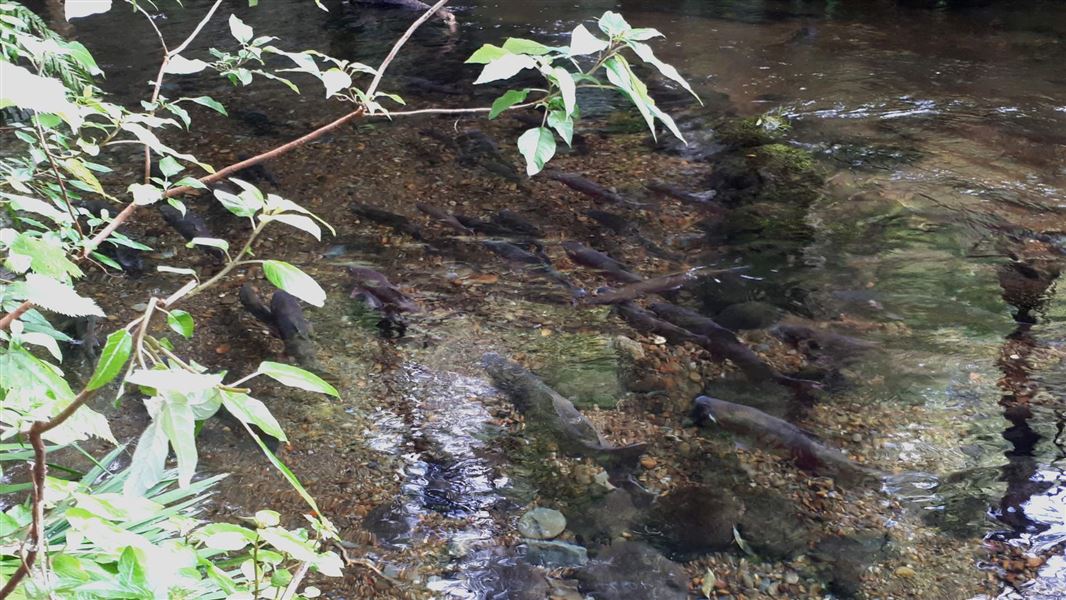
Each year we trap and record trout running up the Waipa stream to spawn. We compare numbers and other data and record changes or differences from past years. This helps us measure and record how healthy and plentiful trout are in Lake Taupo.
The Trap
Our trap at the Waipa Stream captures trout as they make their way to the stream. This provides a record of the sex, size, condition, number of trout in Lake Taupo. We can also check how times individual fish have spawned (iteroparity). Once trout we process the trout, we release them to continue their upstream journey.
Our trap is on a tributary of the Tongariro River, 24km upstream of Lake Taupo. It's been operational since 1998 providing a valuable long-term data set.
How trap data helps assess fishery health
Once we have records of the trapped trout, we combined this data with other data. This can include angler and creel surveys, drift dive records and productivity monitoring.
These data sets help provide a robust understanding of the fishery's health. This helps managers make the right decisions on bag and size limits and fishing seasons.
Fishery health and angler satisfaction are the goals all recreational fisheries aim for. Lake Taupo has about 35 years of records making it the most studied fishery in New Zealand. As a result of this work, it also ranks high in the international context.
Trap Data for May
Compared to May 2018, the number of trout processed was about the same (60 in May 2019 compared to 59 the previous May). But brown trout made up a greater proportion of fish present. This is not a surprise given they run much earlier than rainbows. Their numbers also echo the excellent brown trout anglers reported over summer.
Size and condition
The size and condition of trout recorded is much better than last year.
Led by brown trout, largest weights were a kilogram above last year's records. Average Condition Factor (CF) was also higher. Rainbow hens were larger and in better condition but jacks are slightly down (CF 39 in May 2019 compared to CF 40).
Our graphs visualise the data and we will present more in a consistent fashion over the season. Readers might notice the y-axis on the ‘Number of fish’ graph to be inconsistent with the count. This is in expectation of higher numbers in the year when spawning intensifies.
What this means for the year
Predicting the future is fraught with risk but from what we’ve seen so far, anglers could be in for a good year. The Condition Factor of trout passing through the trap has been high so far. It also aligns with angler feedback who report many landed trout to be in premium condition.
| May 2019 | May 2018 | |||||||||||
|---|---|---|---|---|---|---|---|---|---|---|---|---|
| Brown trout female | Brown trout male | Rainbow trout female | Rainbow trout male | Total | Total rainfall (mm) | Brown trout female | Brown trout male | Rainbow trout female | Rainbow trout male | Total | Total rainfall (mm) | |
| Count | 15 | 23 | 9 | 13 | 60 | 230.0 | 15 | 13 | 16 | 15 | 59 | 231.5 |
| Average length (mm) | 572 | 608 | 506 | 527 | 549 | 562 | 489 | 526 | ||||
| Max length (mm) | 685 | 675 | 545 | 610 | 610 | 600 | 489 | 630 | ||||
| Average weight (kg) | 2.5 | 2.8 | 1.6 | 1.6 | 2.1 | 2.1 | 1.4 | 1.7 | ||||
| Max weight (kg) | 3.8 | 3.8 | 2.0 | 2.1 | 2.8 | 2.8 | 1.7 | 3.0 | ||||
| Condition factor | 49 | 46 | 45 | 39 | 44 | 42 | 42 | 40 | ||||
