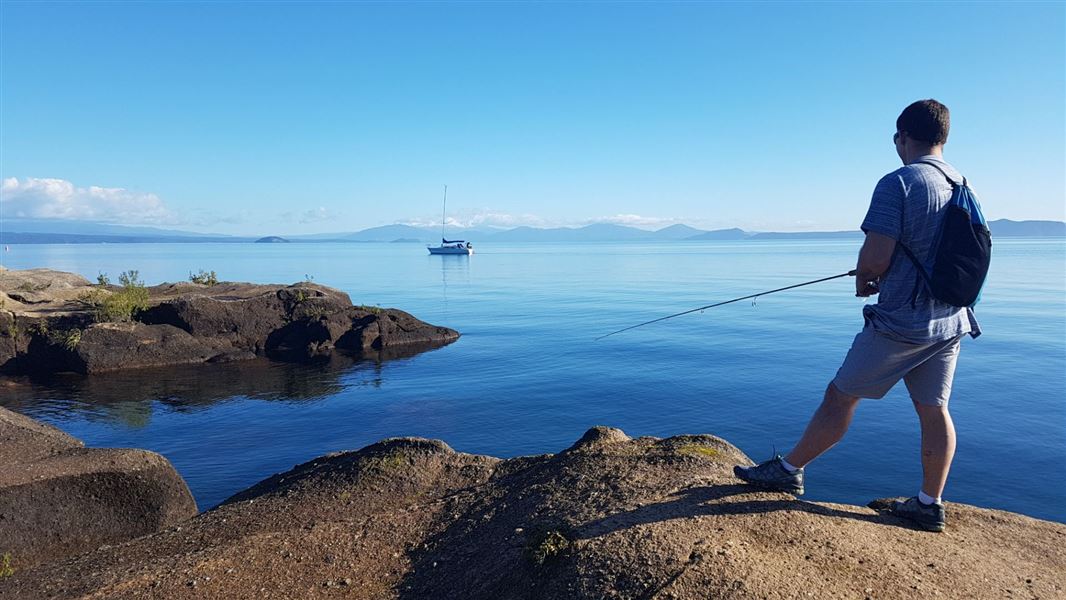
Lake Taupō Fishery Management's aims to protect fish populations and maintain angler satisfaction. As environmental and human drivers determine trout number and quality, this research focuses on:
- fishery biology, such as trout food availability (an environmental driver),
- anglers’ behaviour change such as through regulations limits (human driver).
Lake Taupō has accurate tools that provide robust information on these drivers. We review them here, alongside anglers response to the 2017 changes to size and daily bag limits.
Trout food availability
The production of trout in Taupō depends on the productivity of the lake. Methods to measure productivity differ according to 'trophic level'. A 'trophic level' refers to a position in the food chain.
At the first level, we measure nutrients (nitrate and phosphorus) in the water. At the next level, we measure the concentration of chlorophyll-a in the lake. This indicates that there is plenty of phytoplankton.
On a terrestrial system, this would be like measuring how much grass is on a farm. So we can measure the food available to trout and then measure the number of trout.
Measuring food availability
Nutrients and chlorophyll-a monitoring have been occurring at Lake Taupō since 1994.
The data below shows that conditions often vary one year to the next. But quantifying the impact of these changes is not easy to measure. There are four trophic levels between phytoplankton and trout. Changes in the propagation at the lowest trophic level can also be complex.
So DOC introduced an echo-sounding program that can measure these four trophic levels. This helps to predict impacts on the trout population.
Echo-sounding
Echo-sounding detects fish and fish tracks. The technology is similar to 'fish-finders' used by boat anglers, just far more complex. The 'back-scattering coefficient' measures everything else (zooplankton, smelt, bullies, catfish, and juvenile trout). 'Back-scattering' is the term for how the echo bounces off what it collides with. The strength and 'scatter' indicates what it has hit.
Latest findings
We carried out an autumn survey from 16-18 April 2019. We compared the results with previous years in Graph 1.
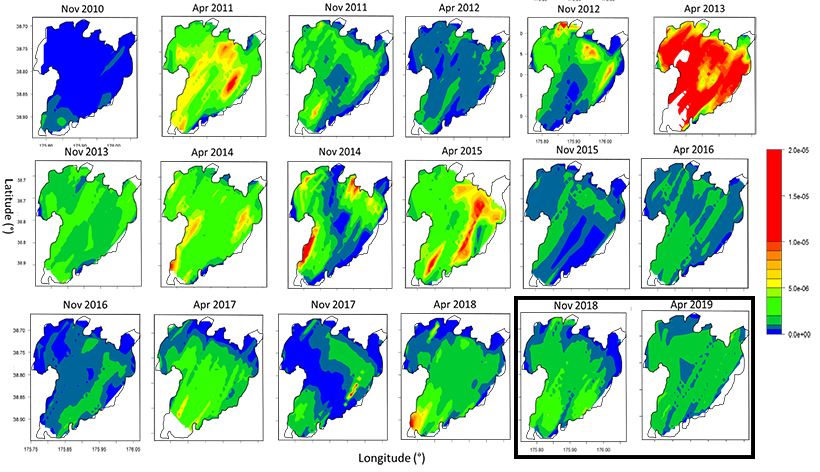
Graph 1: Lake Taupō back-scattering coefficient measured spring (November) and autumn (April), 2010-2019 | See larger (1,000K)
Productivity was not exceptional, so the impacts on the next trout run are uncertain.
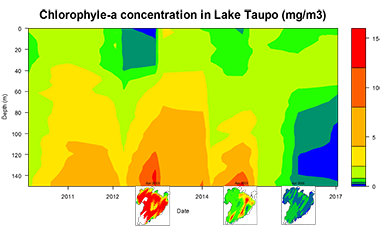
Graph 2: Chlorophyll-a concentration at different depths. Back-scattering coefficient measurements between 2010 and 2017 | See larger (103K)
Back-scattering accuracy
Productivity in Lake Taupō is variable between years and seasons without any pattern. Productivity of the lake in April 2013 and April 2015 was high when compared with November 2010. But to trust these results, it is necessary to have some sort of control.
The Waikato Regional Council (WRC) has been measuring chlorophyll-a concentration. This is a means to measure the lake clarity (how clear the water is). Algal concentration dictates lake clarity.
Graph. 2 is a compilation combining WRC monitoring program results with our echo-sounding results. Chlorophyll-a density was also the most concentrated in April 2013 and 2015 and it was low in April 2016. This shows our back-scattering measurements provide robust estimations of lake productivity levels.
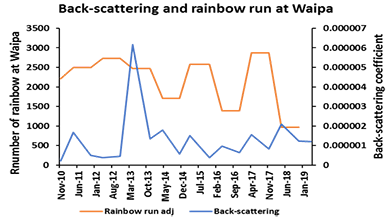
Graph 3: Relationship between annual back-scattering and size of the rainbow trout run at Waipa | See larger (69K)
Back-scattering and predicting trout spawning
The relationship between back-scattering and the resulting number of fish (Graph. 3) is complex.
Fish that face variable productivity conditions are of different age. So the relationship between lake productivity and the size of trout doesn’t have a clear pattern. So the number of trout indexed by the size of the spawning runs in the Waipa trap doesn't predict trout numbers.
We have tried many scenarios to address this. Lag-times between measurements and adapting run size has not helped patterns to emerge.
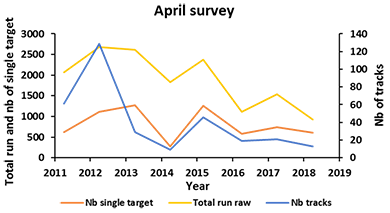
Graph 4: Relationship between single trout and tracks measured by April echo surveys and size of run trapped in Waipa Stream 2019 | See larger (PNG, 104K)
Innovating a new tool
There is a better basis for predictions with a reasonable level of certainty. The relationship between trapped trout, alongside single targets and tracks.
Graph 4 demonstrates those detected during the April echo-survey of the same year.
So we have now a tool, albeit, still a bit blunt to make predictions in April, of what the run might look like later in the year.
In April 2019 (graph 5), the number of single targets was “average” compared to previous years. Going by past years, we can predict 1600-2300 trout will migrate into and through the Waipa trap.
Predicting the condition of these fish when they migrate to spawn is much more difficult. Lake condition is unknown for the next few months which can affect trout at their return.
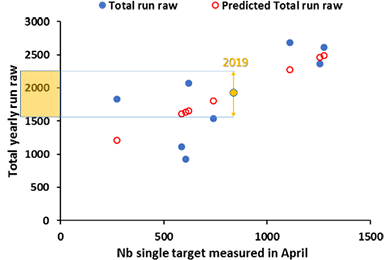
Graph 5: Predicted total annual runs trapped in Waipa from the number of single targets detected during April (2010-2019). The values for the number of single targets and the corresponding total run for 2019 are in yellow | See larger (PNG, 23K)
Measuring angler’s behaviour and regulations impact
If we can predict angler behaviour, we can take action to protect these populations. We can also take actions to maintain and enhance angler satisfaction.
Using angler's surveys, we've gauged uptake of the new size and daily bag limits. New fishery regulations were established during 2017. They lowered the limit for kept fish to 35cm (from 40cm) and raised the bag limit (number of fish you could keep) from 3 to 6. They also reduced the distance on restricted fly-fishing areas at river mouths.
Results were in two groups - lake and river anglers. Even though they overlap, these groups often have different harvest-oriented motivations for fishing.
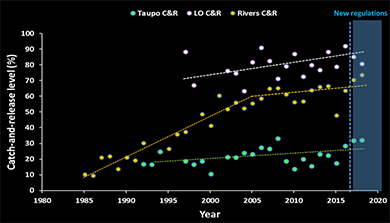
Graph 6. Level of catch-and-release in the Taupō fisheries from 1985 - 2018. The green dots are values for Lake Taupō. White dots are for Lake Otamangakau. Orange dots are for some Taupō rivers (Tongariro, Tauranga-Taupō, and Hinemaiaia). The shaded area represents the years with the new regulations | See larger (PNG, 143 K)
Catch-and-release and size limits
We measured the extent of catch-and-release carried out by lake and river anglers. We calculated the total number of legal-size fish caught out of all caught and released trout (Graph 6).
According to our data, new regulations did not affect the extent of catch-and-release.
Bag limits
Productivity within Lake Taupō dictates the quantity and quality of adult fish when they return to spawn. So if growing conditions are not good, the condition of the fish will be low, and their numbers will decrease.
In such situations, it is imperative to reduce the number of fish to allow for their food to recover. When fish are returning to spawn, they have already taken their share of food in the lake. So removing fish at this stage won't speed recovery enough. This is because of a phenomenon called “compensation”[i].
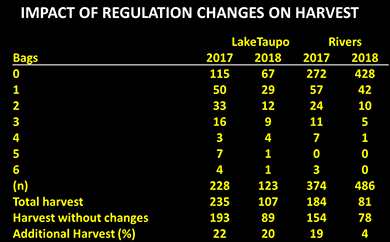
Table 1. Summary of the sizes of the daily bags recorded during anglers’ surveys in 2017 and 2018. This follows the increase of the daily bag limit from 3 to 6 in 2017 | See larger (PNG, 42K)
The numbers of harvested fish have increased since the new regulations (Table 1). Anglers have harvested 22% and 20% more fish in 2017 and 2018 respectively.
The river anglers increased their harvest (2017 by 19%). But the increase was less significant the following year (2018 by 4%). Both marked an increase in fish harvested compared to previous regulations.
The response of anglers to new bag regulations will allow trout food sources to recover. Lake anglers have helped improve the fishery's health by reducing harvest when needed.
Note
Compensation: This is when production (surviving eggs and juveniles) per female spawning is greater than when few spawn. This phenomenon allows fisheries harvesting to reach a high level before collapsing. For example, it is not uncommon to harvest more than 50% of the population of salmon before they spawn. Remaining females see an increase in egg survival and their juveniles (compared to a larger population of spawning fish). This is enough to increase their produce to compensate for the loss of other females.
