Archived content: This media release was accurate on the date of publication.
Date: 13 February 2020
Lake productivity appears exceptionally patchy this year with a very high concentration in the South Eastern corner of the lake.
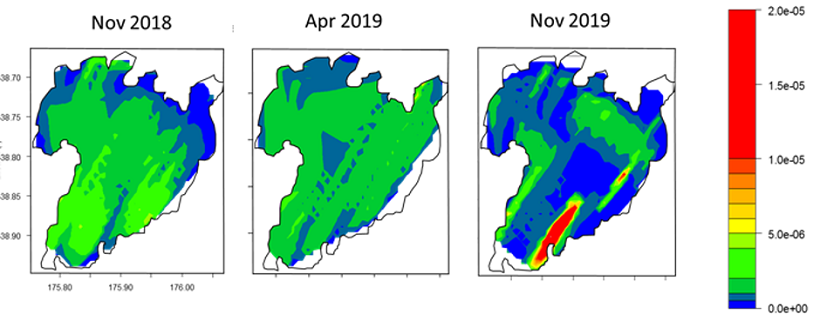
Graphs of Lake Taupō's productivity for November 2018, April 2019 and November 2019
November comparison
As the illustration shows, the area from Stump Bay to Motutaiko Island is particularly rich in aquatic life with another smaller spike in concentration evident around the Horomatangi Reef.
What sets the November 2019 data apart from previous years is the big difference between the two hot-spots, compared to other areas of the Lake where productivity is very low. While patchy distribution is not unusual, the extreme highs and lows seen in this sample are striking.
By comparison, the productivity distribution from November 2018 was far more uniform. This means plankton, smelt and trout were spread more evenly around the lake. While distribution is subject to change, overall Lake productivity levels recorded in the November samples remains consistent.
April comparison
A comparison with April 2019 shows overall productivity is slightly lower, which is typical for this time of year. Once again, the distribution pattern was more uniform.
Returning to the latest results, the full implications of this patchy distribution is still unknown. From a fishing perspective, anglers can expect the greatest success while targeting the hot-spots – which is supported by reports from anglers. In terms of cause, we know phytoplankton (which occupy level 1 in the trophic chain) are unable to swim, so we believe lake currents must have a bearing on their distribution. We will better understand the factors driving this system as the program goes on.
Ecosystem and trout
The variability seen in the data confirms the dynamic nature of Lake Taupō’s ecosystem, which in turn underlines the challenges that face our wild trout. It also goes some way to explaining why trout spawning runs can change significantly from year to year.
Data collection
Collecting data involves towing a large specialist transducer behind a boat and recording the stream of information on a computer – in effect, a very sensitive, advanced fish-finder! The operation takes three days to complete and covers approximately 110kms. The data is collected along seven paths or transects across the lake, which remains constant from year to year - allowing scientists to make meaningful comparisons over time. A filter is then applied to the raw data which enables the team to differentiate trout, smelt and plankton.