First determine your habitat connectivity, habitat size and predator control levels of the translocation site; then view the predicted success of translocations for different scenarios.
Points to note if you are translocating this species
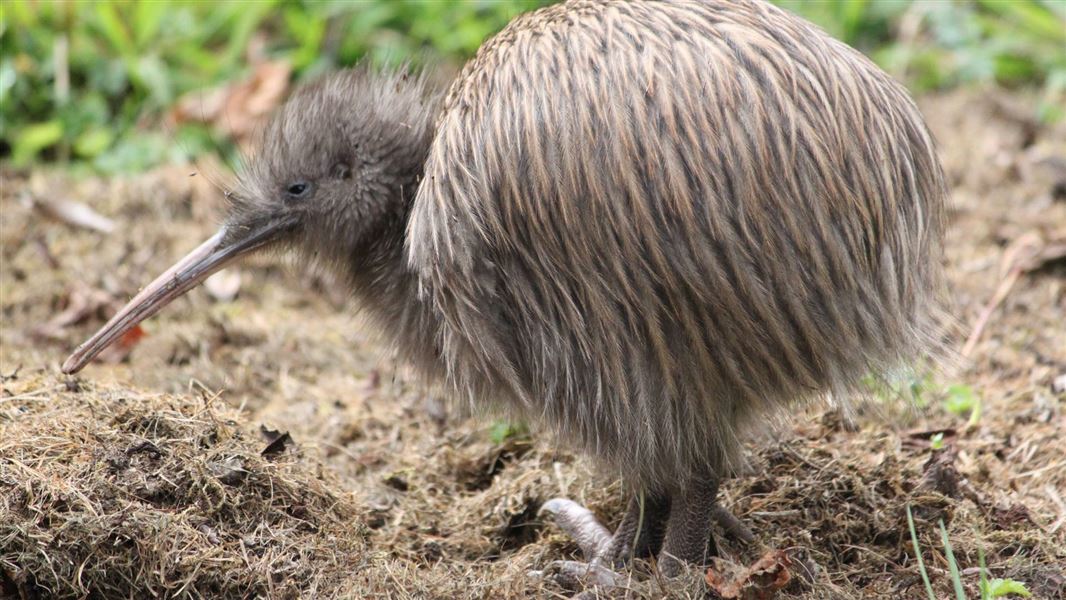
Kiwi live in a variety of habitats, including native and exotic forests, scrublands and rough farmland.
A lot of information is available in the Kiwi Best Practice Manual.
Source populations for North Island kiwi are in short supply. The Kiwi Recovery Group leads the recovery of the species on a national scale and determines priorities for translocations to ensure the fastest rate of recovery.
If you are planning to translocate kiwi, you should be prepared to expand protected areas to encompass the territories of birds that disperse. This will be critical during the establishment phase following the initial translocation.
Factors of success for North Island brown kiwi
Founder number for maximising genetic diversity
40
Habitat connectivity
Low (isolated)
Dispersal will be unlikely or low on islands, fenced mainland sites, or sites with a physical barrier (e.g. mountain ranges).
Medium and High (adjoining)
Dispersal will occur at any site that lacks a physical barrier. North Island kiwi can disperse across farmland and other unsuitable habitat. Some birds have been successfully retrieved and returned to the release site, but this requires intensive monitoring of all individuals with radio transmitters.
Habitat size
Kiwi density varies from c. one pair per 5 ha in Waitangi State Forest though to one pair per 100 ha in the Kaweka Range. Consequently, each site should be assessed by kiwi experts before a translocation to determine its potential carrying capacity. The Kiwi Recovery Group recommends a minimum of 500 ha for a kiwi translocation site. A population of 500 birds should be sufficient to retain allelic diversity.
Small (minimum area)
Site can maintain 30 pairs (actual size depends on the habitat type)
Medium
Site can maintain 100 pairs (actual size depends on the habitat type)
Large
Site can maintain ≥ 250 pairs (actual size depends on the habitat type)
Minimum predator control
If you are translocating North Island brown kiwi, you will need to maintain predators at a low density at the release site at a minimum. However, overall survival and productivity will probably be higher at sites where predators are eradicated or maintained at zero density.
Predators maintained at low density
Adult kiwi are particularly vulnerable to predation by dogs and ferrets, while juvenile kiwi are highly vulnerable to predation by stoats, ferrets and cats. Therefore, you will need to control all of these species to best practice standards and potentially exclude or control dogs. Rats, pigs and possums are not significant predators of kiwi but they are competitors, so controlling these at kiwi translocation sites will also likely benefit your establishing kiwi population. It is also important to be aware that vehicles can be a significant source of kiwi mortality at sites that are adjacent to or bisected by roads.
Predators eradicated
This requires the total eradication of all target predators with the exception (in most cases) of mice, or the maintenance of zero density year-round.
Predicted success for scenarios
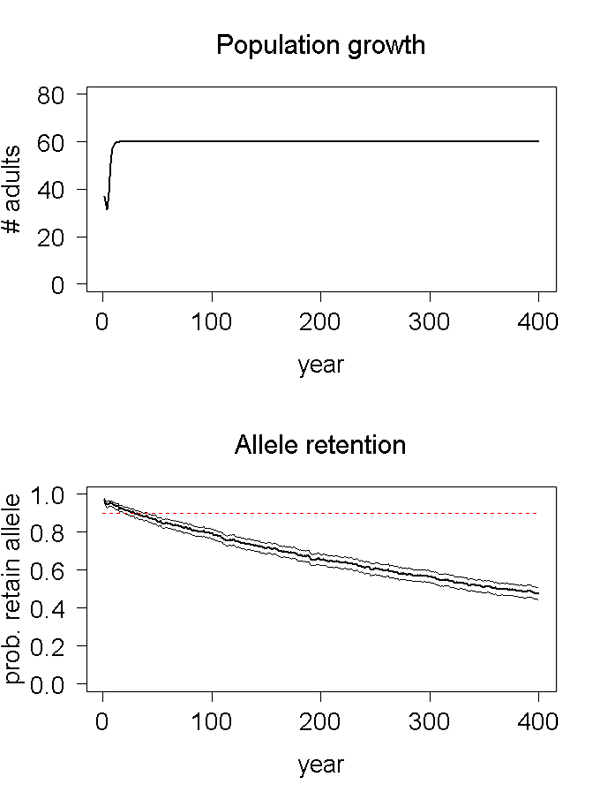
North Island brown kiwi: Scenario 1
Scenario: Low habitat connectivity, small habitat size, predators maintained at low density.
Data source: Average mainland productivity and survival were estimated by experts and taken from Robertson & de Monchy (2012) rather than based on translocation outcomes; and lifespan and generation length were intuitive estimates by experts. Consequently, there is no certainty in the results.
Conditions: 40 birds were translocated in year one; the carrying capacity of the site was 60 kiwi; there was no migration.
Outcome: A viable population will likely establish, but some genetic diversity will be lost over ten generations, which could affect the long-term persistence of the population. You could improve this result by choosing a larger site (see Scenarios 3 and 5).
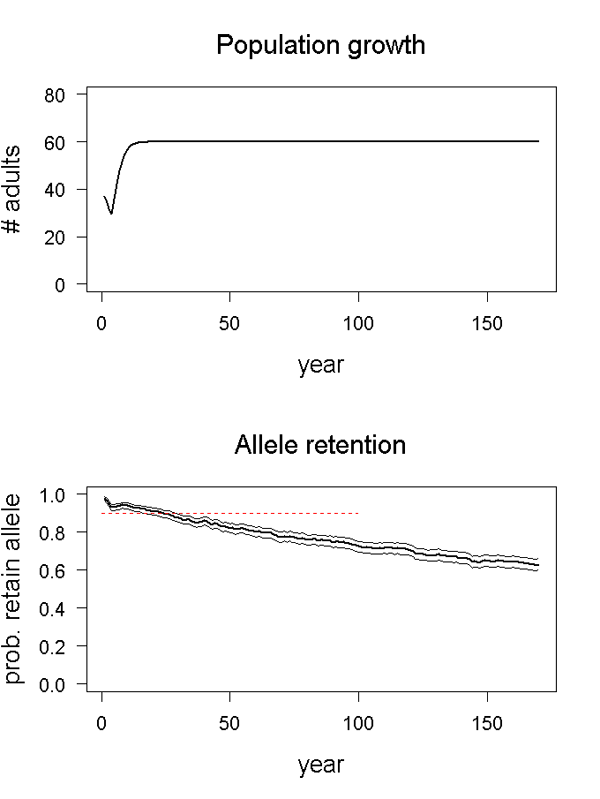
North Island brown kiwi: Scenario 2
Scenario: Low habitat connectivity, small habitat size, predators eradicated.
Data source: Average mainland productivity and survival were estimated by experts and taken from Robertson & de Monchy (2012) rather than being based on translocation outcomes; and lifespan and generation length were intuitive estimates by experts. Consequently, there is no certainty in the results.
Conditions: 40 birds were translocated in year one; the carrying capacity of the site was 60 kiwi; there was no migration.
Outcome: A viable population will likely establish, but some genetic diversity will be lost over ten generations, which could affect the long-term persistence of the population. You could improve this result by choosing a larger site (see Scenarios 4 and 6).
North Island brown kiwi: Scenario 3
Scenario: Low habitat connectivity, medium habitat size, predators maintained at low density.
Data source: Average mainland productivity and survival were estimated by experts and taken from Robertson & de Monchy (2012) rather than being based on translocation outcomes; and lifespan and generation length were intuitive estimates by experts. Consequently, there is no certainty in the results.
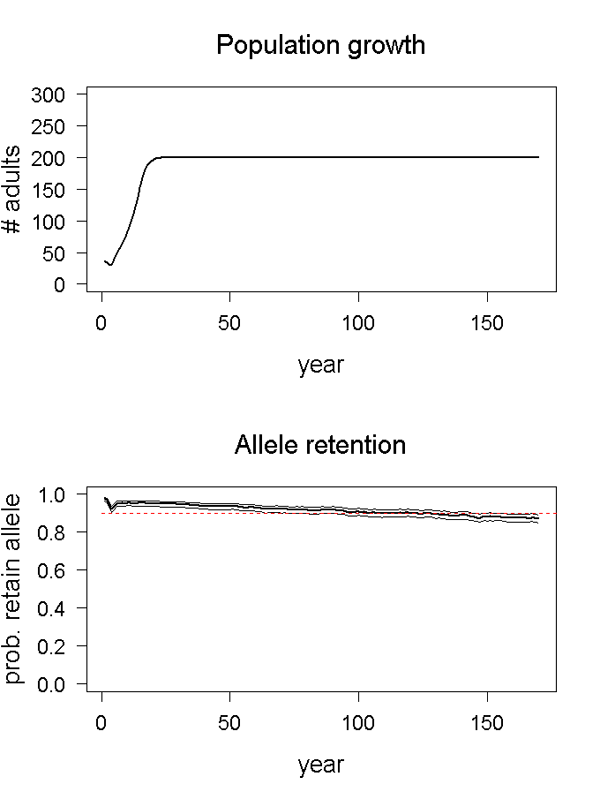
Conditions: 40 birds were translocated in year one; the carrying capacity of the site was 200 kiwi; there was no migration.
Outcome: A viable population will likely establish and 80–90% of genetic diversity will be maintained over ten generations.
North Island brown kiwi: Scenario 4
Scenario: Low habitat connectivity, medium habitat size, predators eradicated.
Data source: Average mainland productivity and survival were estimated by experts and taken from Robertson & de Monchy (2012) rather than being based on translocation outcomes; and lifespan and generation length were intuitive estimates by experts. Consequently, there is no certainty in the results.
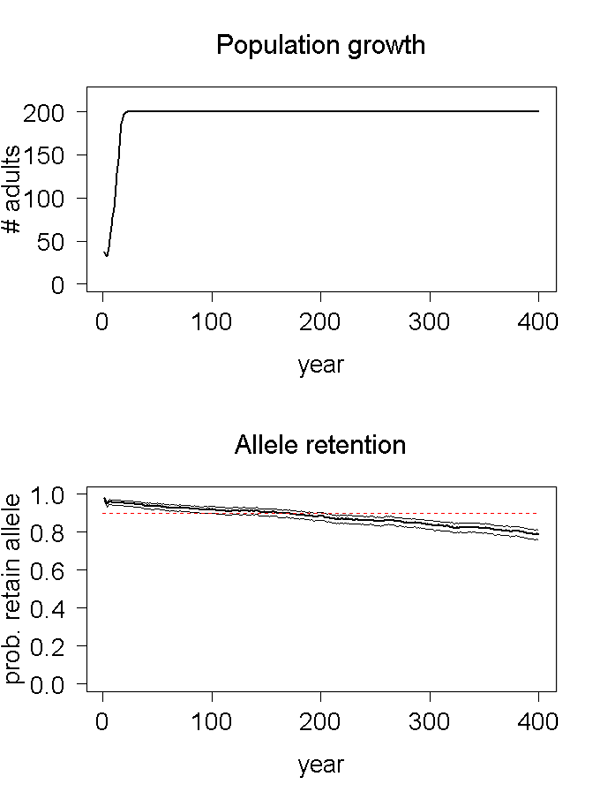
Conditions: 40 birds were translocated in year one; the carrying capacity of the site was 200 kiwi; there was no migration.
Outcome: A viable population will likely establish and 90% of genetic diversity will be maintained over ten generations.
North Island brown kiwi: Scenario 5
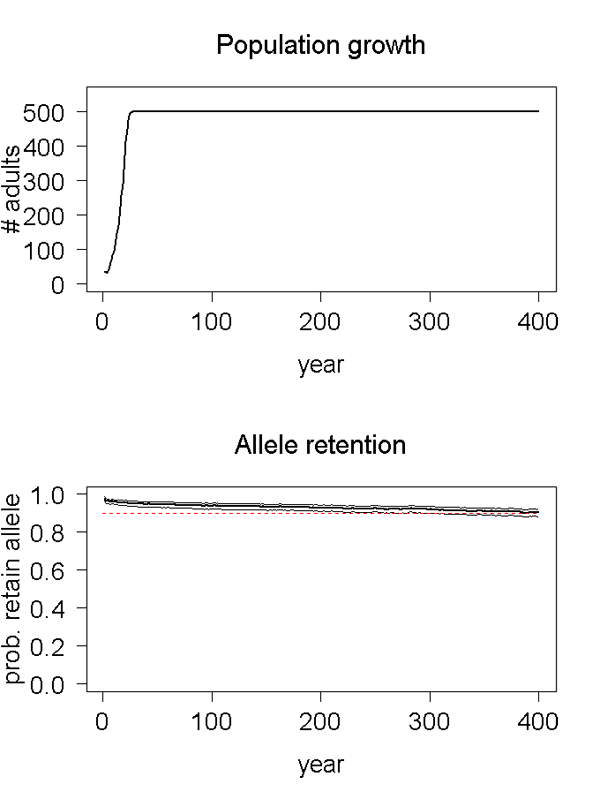
Scenario: Low habitat connectivity, large habitat size, predators maintained at low density.
Data source: Average mainland productivity and survival were estimated by experts and taken from Robertson & de Monchy (2012) rather than being based on translocation outcomes; and lifespan and generation length were intuitive estimates by experts. Consequently, there is no certainty in the results.
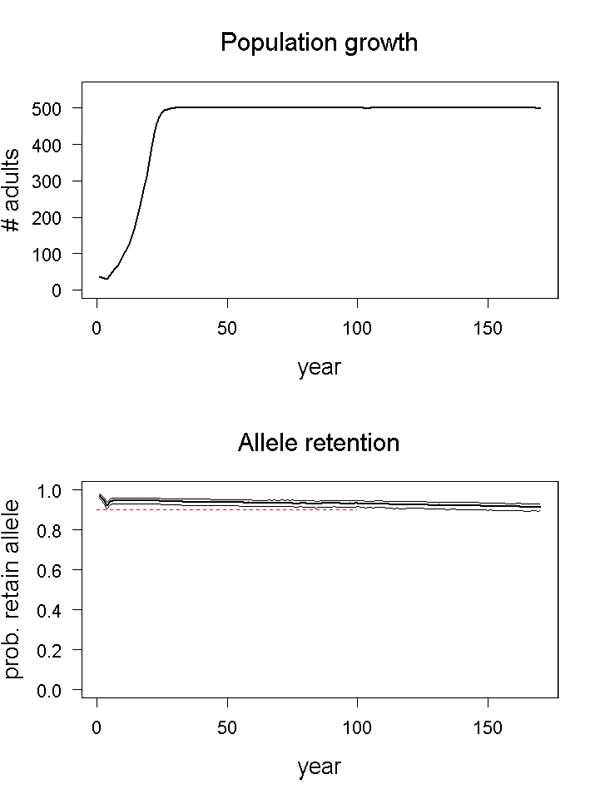
Conditions: 40 birds were translocated in year one; the carrying capacity of the site was 500 kiwi; there was no migration.
Outcome: A viable population will likely establish and 90% of genetic diversity will be maintained over ten generations.
North Island brown kiwi: Scenario 6
Scenario: Low habitat connectivity, large habitat size, predators eradicated.
Data source: Average mainland productivity and survival were estimated by experts and taken from Robertson & de Monchy (2012) rather than being based on translocation outcomes; and lifespan and generation length were intuitive estimates by experts. Consequently, there is no certainty in the results.
Conditions: 40 birds were translocated in year one; the carrying capacity of the site was 500 kiwi; there was no migration.
Outcome: A viable population will likely establish and 90% of genetic diversity will be maintained over ten generations.